Return on Investment (ROI) Infographics

Return on Investment (ROI) Infographics
Free PowerPoint template and Google Slides theme
At the end of every high-stakes meeting, someone is going to ask the million-dollar question: “What’s the bottom line?” Whether you’re pitching a 2026 tech stack upgrade, a new marketing funnel, or a sustainability initiative, you can’t answer that question with a wall of text. In the boardroom, clarity is currency. If you can’t visualize the value, the budget probably isn’t happening.
The Return on Investment (ROI) Infographics for Google Slides and PowerPoint is designed to do the heavy lifting for you. It’s a specialized toolkit that turns dense financial data into a “yes-worthy” visual argument.
The Aesthetic: High-Stakes Minimalism
This isn’t a “fun” deck—it’s a power deck. The design language is engineered to project authority and precision:
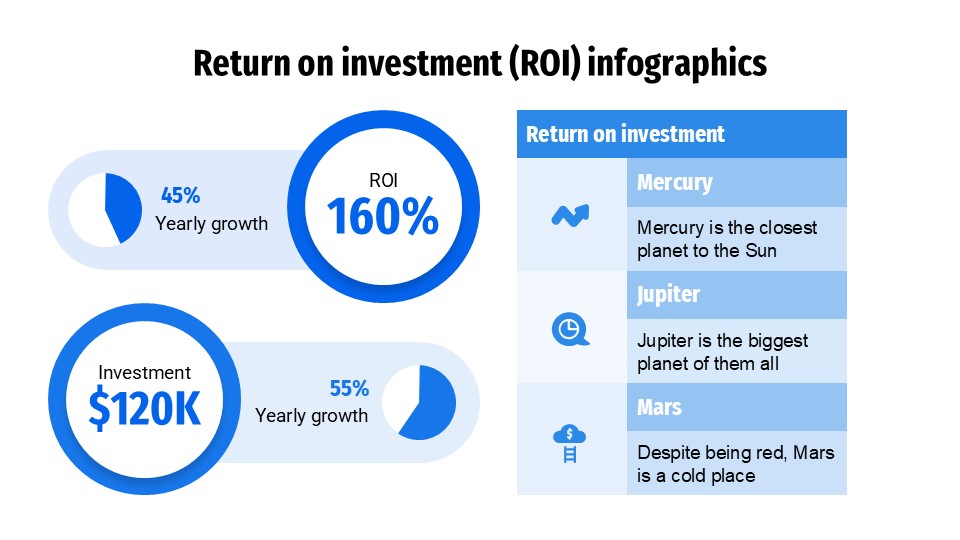
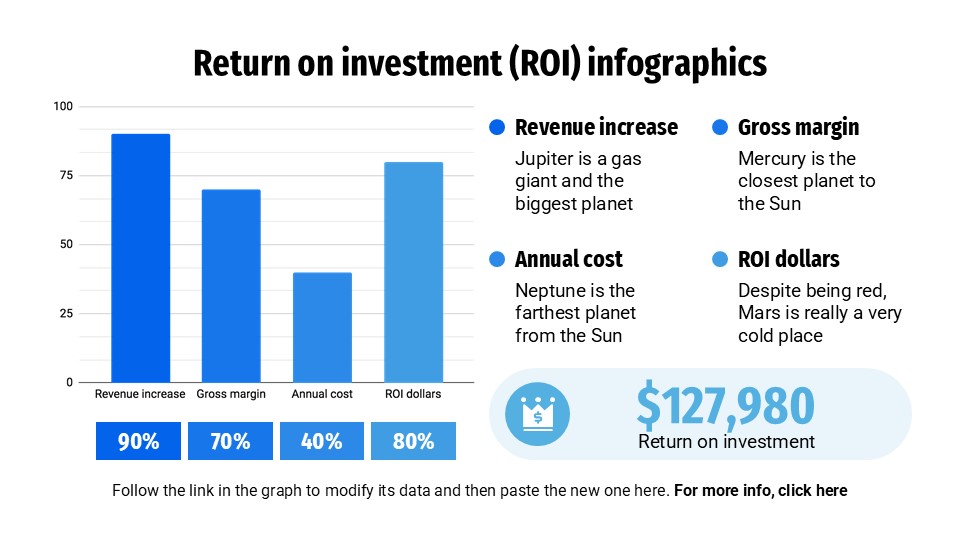
The “Profitable” Palette: The design utilizes a high-contrast mix of deep navy, slate grey, and “success green.” This color story immediately signals growth and stability to your stakeholders.
Architecture of Accuracy: Every infographic—from the tiered pyramids to the radial progress bars—is built on a clean, geometric grid. It feels “locked in” and professional, ensuring your numbers are the focus, not the decorations.
Sleek Data Viz: We’ve traded clunky, default Excel charts for modern, flat-design vectors. These graphics stay crisp on everything from a handheld tablet to a 4K boardroom projector.
Purpose & 2026 Strategic Use Cases
This is more than just a set of charts; it’s a Decision-Support Engine built for the 2026 fiscal landscape:
Marketing Attribution & Spend: Perfect for showing how your Q1 ad spend directly fueled the Q3 revenue spike.
AgTech & Innovation Pitches: If you’re presenting the ROI of shifting to automated systems or green energy, these slides help you map out the “break-even” point with surgical clarity.
Human Capital & Training: Use the “Before vs. After” infographics to justify the cost of team upskilling by showing the resulting productivity gains.
SaaS & Capital Expenditure (CapEx): Ideal for IT leads who need to prove that the upfront cost of new software will pay for itself through efficiency in under 12 months.
Features of this template
- 100% editable and easy to modify
- 32 Different slides to impress your audience
- Contains easy-to-edit graphics such as graphs, maps, tables, timelines and mockups
- Includes 500+ icons for customizing your slides
- Designed to be used in Google Slides, Microsoft PowerPoint & Canva
- Includes information about fonts, colors, and credits of the resources used
Video Preview of Return on Investment (ROI) Infographics
Share Now!
Presentation Tips


Recent Templates

Related Products
Same Contributor


Featured Products