Green Pie Chart PowerPoint Template
Green Pie Chart Infographics Templates
Free PowerPoint template and Google Slides theme
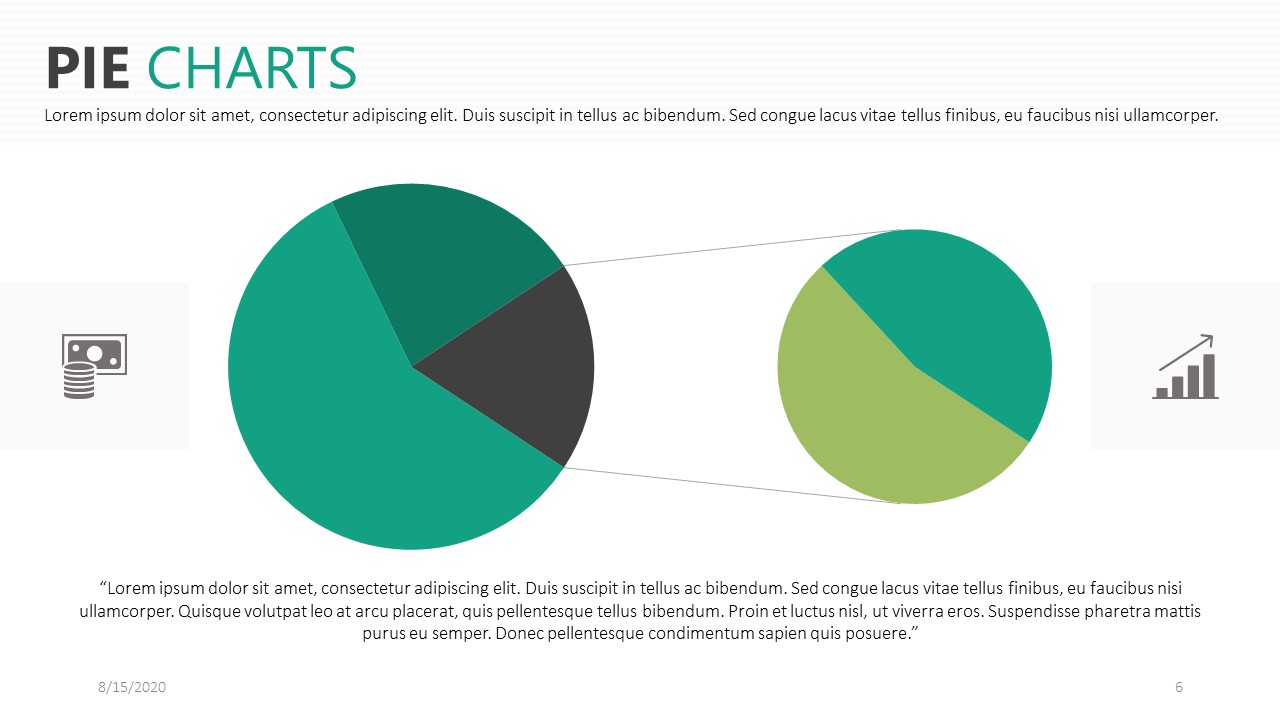
Pie charts are powerful visual tools that you can use to represent and compare percentages or proportions, and they can be useful in multiple scenarios, such as showing data about your company, describing your customer distribution, or even for medical or educational topics. They look like pies or even doughnuts, with each element representing a slice.
The palette color used for this template is green, and of course, you can customize it.
Features of these infographics
- Circular infographics and chart visualizations
- 100% editable and easy to modify
- 8 different infographics to boost your presentations
- Designed to be used in Google Slides, Microsoft PowerPoint and Keynote
- 16:9 widescreen format suitable for all types of screens
Share Now!
Presentation Tips


Related Products
Same Contributor


Featured Products