Creating flowcharts in Microsoft PowerPoint is a powerful way to visually communicate processes, workflows, and decision paths. Whether you’re outlining a project, illustrating a concept, or structuring ideas, PowerPoint provides several tools for building polished, professional flowcharts. In this guide, we’ll walk you through how to create flowcharts using SmartArt, shapes, and customizable templates.
Option 1: How to Create a Flow chart in PowerPoint Using SmartArt
SmartArt is one of the simplest ways to create flowcharts in PowerPoint. Follow these steps:
- Select the PowerPoint slide where you want to insert the flow chart. To insert SmartArt Graphic:
- Go to the “Insert” tab on the Ribbon.
- Click on “SmartArt” in the Illustrations group.
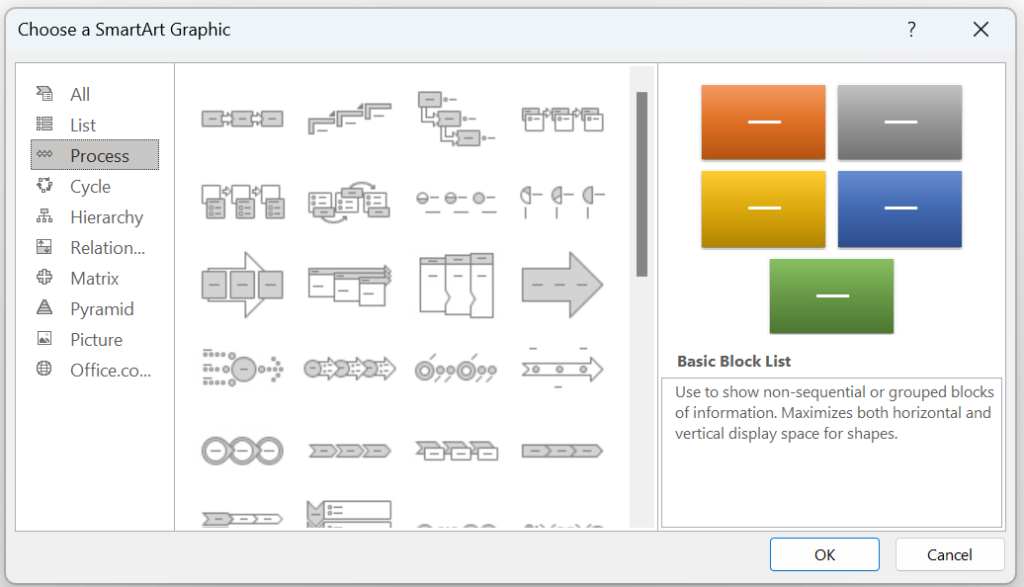
- Choose a SmartArt Graphic:
- In the “Choose a SmartArt Graphic” popup box click on “Process” from the list on the left. Select the flowchart style that suits your needs (there are a lot of options including groupings for Process, Cycle and Hierarchy)
- Click “OK” to insert the SmartArt graphic into your slide.

- Once you have added the SmartArt Graphic to your PowerPoint slide, you can edit the text and layout:
- Click on each shape within the SmartArt graphic to add text
- Use the SmartArt tools on the Ribbon to change the layout, colors and styles of your flow chart
Option 2: How to Create a Flow Chart in PowerPoint Using Shapes
For more customization, you can manually create a flow chart using shapes. To do this:
- Select the slide where you want to insert the flow chart and insert shapes:
- Go to the “Insert” tab on the Ribbon.
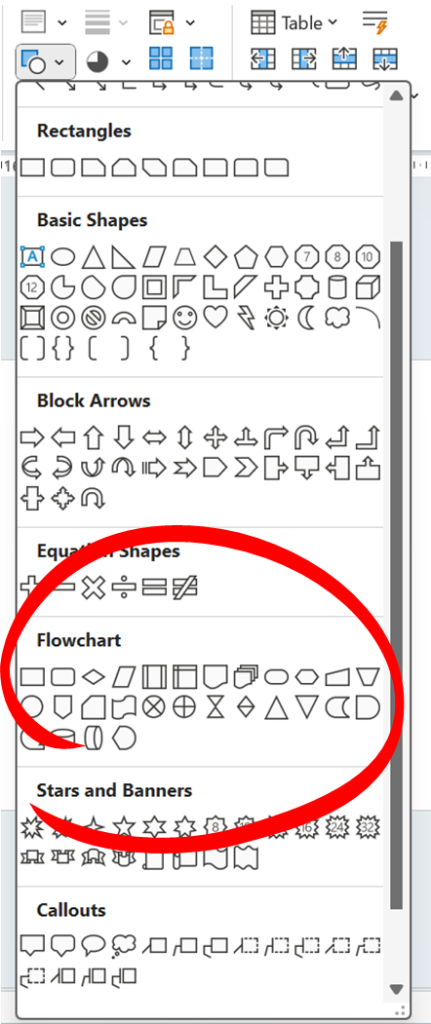
- Click on “Shapes” in the Illustrations group.
- Choose the shapes you need for your flow chart (PowerPoint has a lot of the standard flow chart shapes available for easy selection e.g., rectangles for steps, diamonds for decision points, arrows for connections).

- Connect Shapes:
- To add connectors between shapes, go back to the “Shapes” menu and select a line or arrow.
- Click on the first shape, drag the connector to the second shape, and release.
- Add Text:
- Click on each shape to add text.
- Format the text as needed using the options in the “Home” tab.
Option 3: How to Create a Flow Chart in PowerPoint Using Templates
PowerPoint offers templates specifically designed for flow charts. Here’s how to use them:
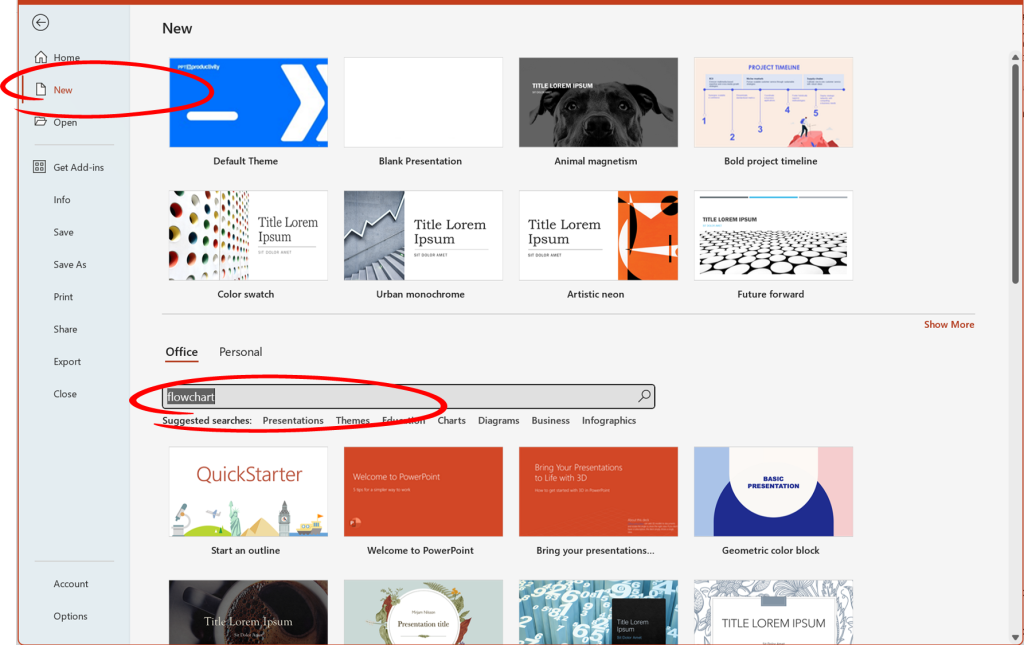
- Go to the “File” tab and select “New.”
- In the search bar, type “Flowchart” and press Enter (note: Microsoft seems to have decided that flowchart should be a single word as flow chart does not return results!).


- Select a Template:
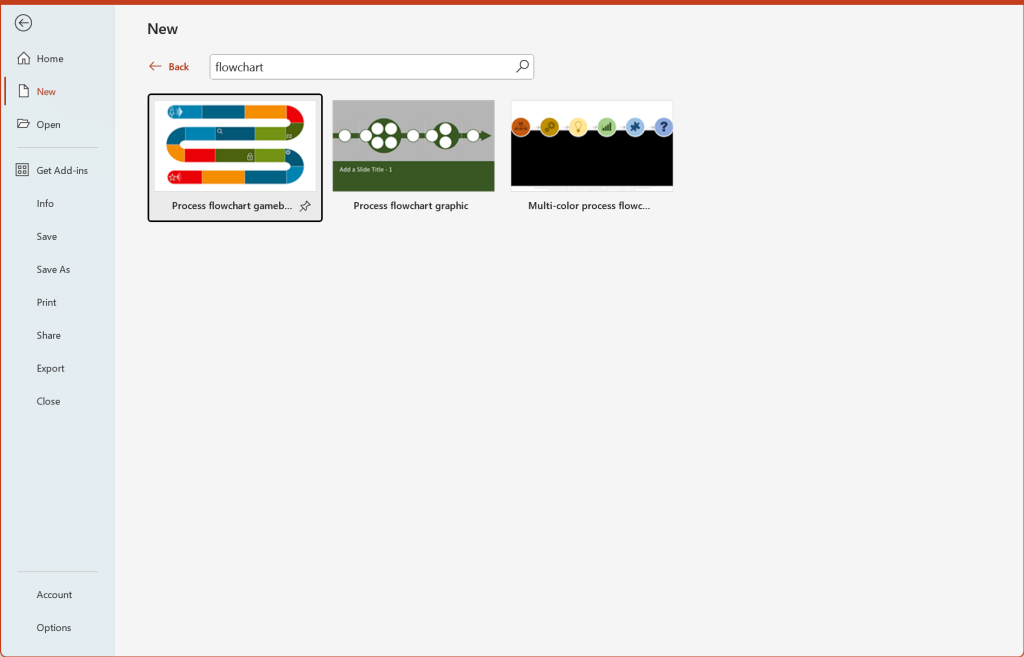
- Browse through the available flow chart templates.
- Click on the template you want to use and then click “Create.”
- Customize the Template:
- Replace the placeholder text with your own content.
- Adjust the shapes, connectors, and layout as needed.
Additional Tips for Creating Flow Charts in PowerPoint
- Align and Distribute Shapes: Use the “Align” and “Distribute” options under the “Format” tab to keep your flow chart neat and organized.
- Use Grid and Guides: Enable gridlines and guides from the “View” tab to help align your shapes more precisely.
- Format Shapes: Customize the appearance of your flow chart by changing the fill, outline, and effects of your shapes in the “Format” tab.
Hopefully these tips help you to create your flowchart. There are many beautiful flowchart Infographics templates on GreatPPT that you can download for free, discover our engaging Google Slides and PowerPoint slides full of infographics to present your information or data clearly and quickly!
