Stock Market Infographics


Stock Market Infographics
Free PowerPoint template and Google Slides theme
Ready to turn complex market data into a work of art? Our “Stock Market Infographics Aesthetic” template is your essential tool for crafting beautiful, professional, and easily understandable financial presentations! As a free Google Slides theme and PowerPoint template, this isn’t just a basic design, it’s a sophisticated resource engineered to make your stock market insights visually compelling and impossible to ignore.
Imagine presenting your analysis—from market trends and investment strategies to financial performance—with stunning, data-driven infographics that immediately captivate your audience. This free template is designed to help you showcase content in a more visual way, ensuring your audience, whether they are investors, students, or colleagues, grasps the topic effortlessly and retains key information.
With 100% editable and user-friendly infographics, you have complete creative freedom to tailor every chart, diagram, and timeline to your specific data. Stop relying on dense charts and start using the power of beautiful visuals to communicate your expertise. Elevate your financial presentations and make your next talk an unforgettable and illuminating experience!
Features of this template
- 100% editable and easy to modify
- 11 Different slides to impress your audience
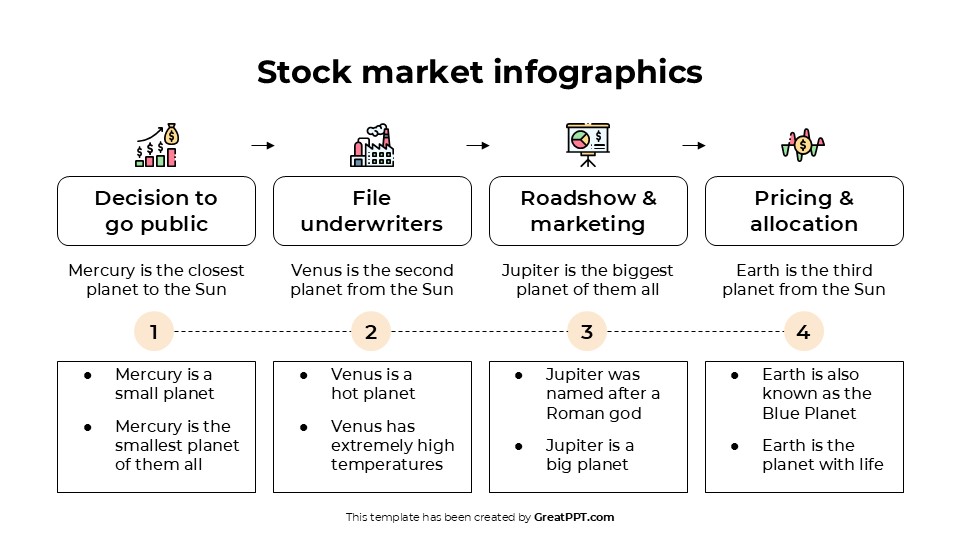
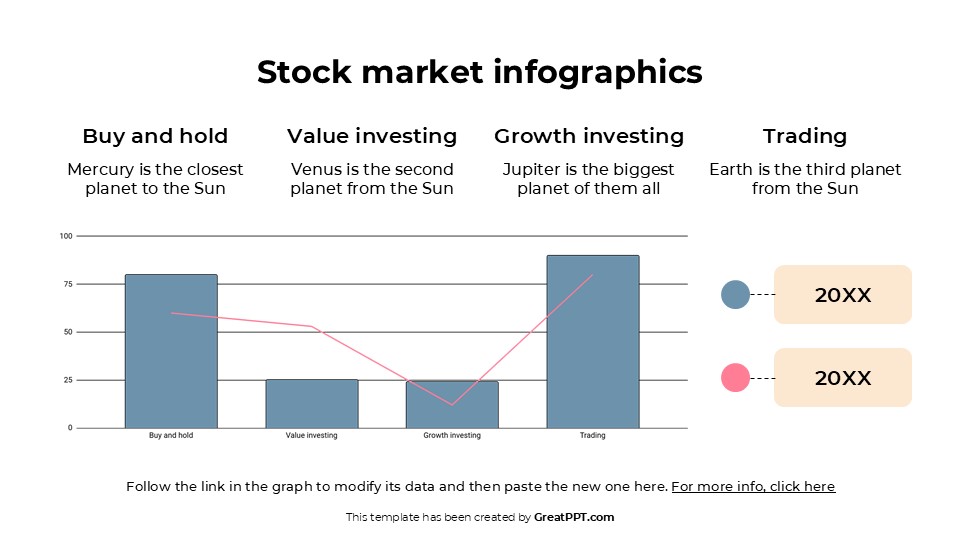
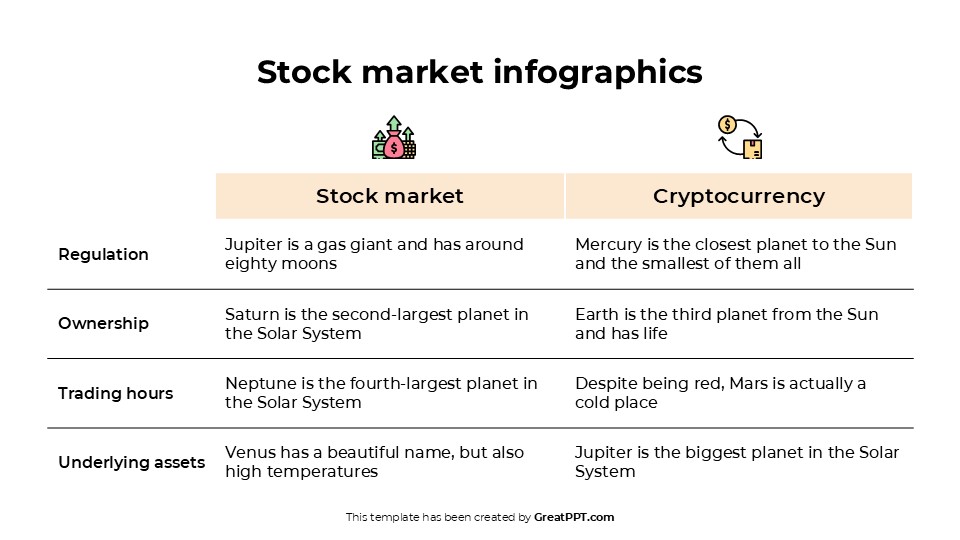
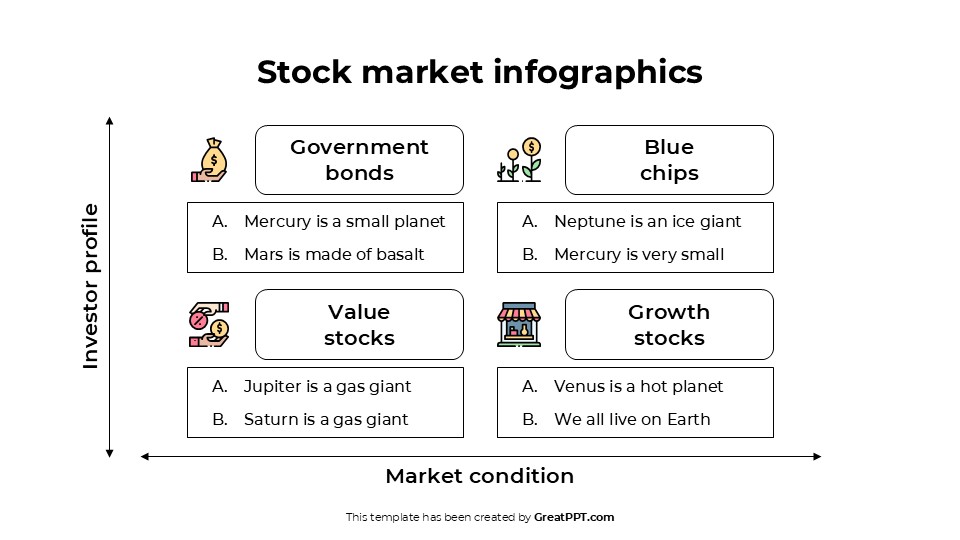
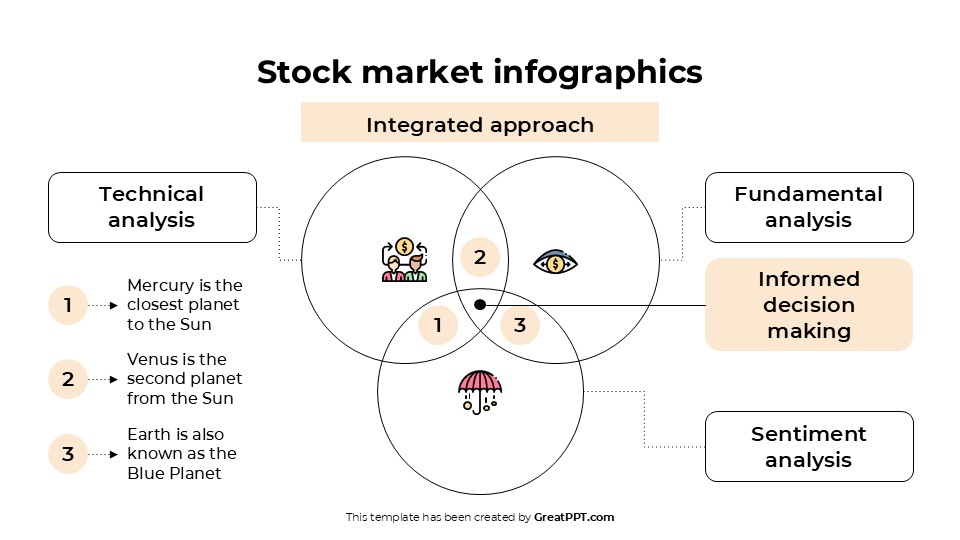
- Contains easy-to-edit graphics such as graphs, maps, tables, timelines and mockups
- Includes 500+ icons and Flaticon’s extension for customizing your slides
- Designed to be used in Google Slides and Microsoft PowerPoint
- Includes information about fonts, colors, and credits of the resources used
Video Preview of Stock Market Infographics
Share Now!
Presentation Tips


Related Products


Same Contributor


Featured Products