SEO Infographics
SEO Infographics
Free PowerPoint template and Google Slides theme
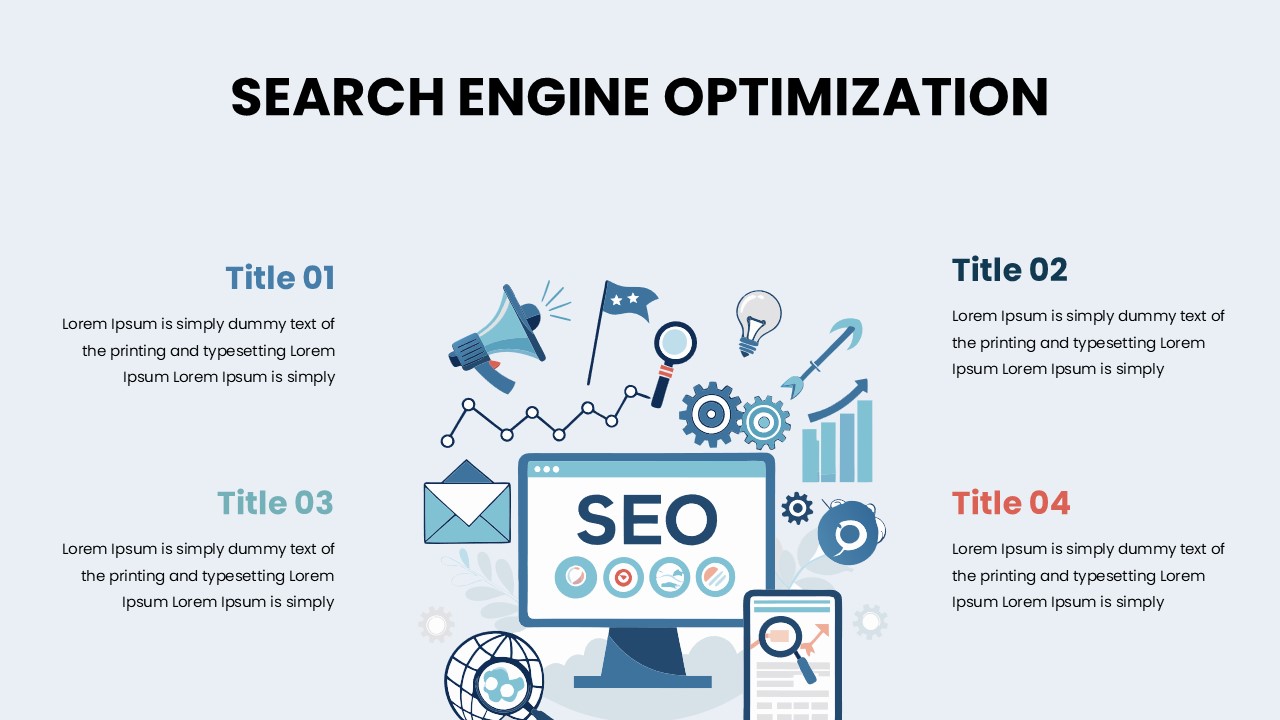
Presenting SEO data in a way that actually engages people is hard—but the Free SEO Infographics makes that job a lot easier. Designed for both PowerPoint and Google Slides, this template turns raw numbers—traffic growth, keyword rankings, conversions—into visual stories that clients, bosses, or team members really get.
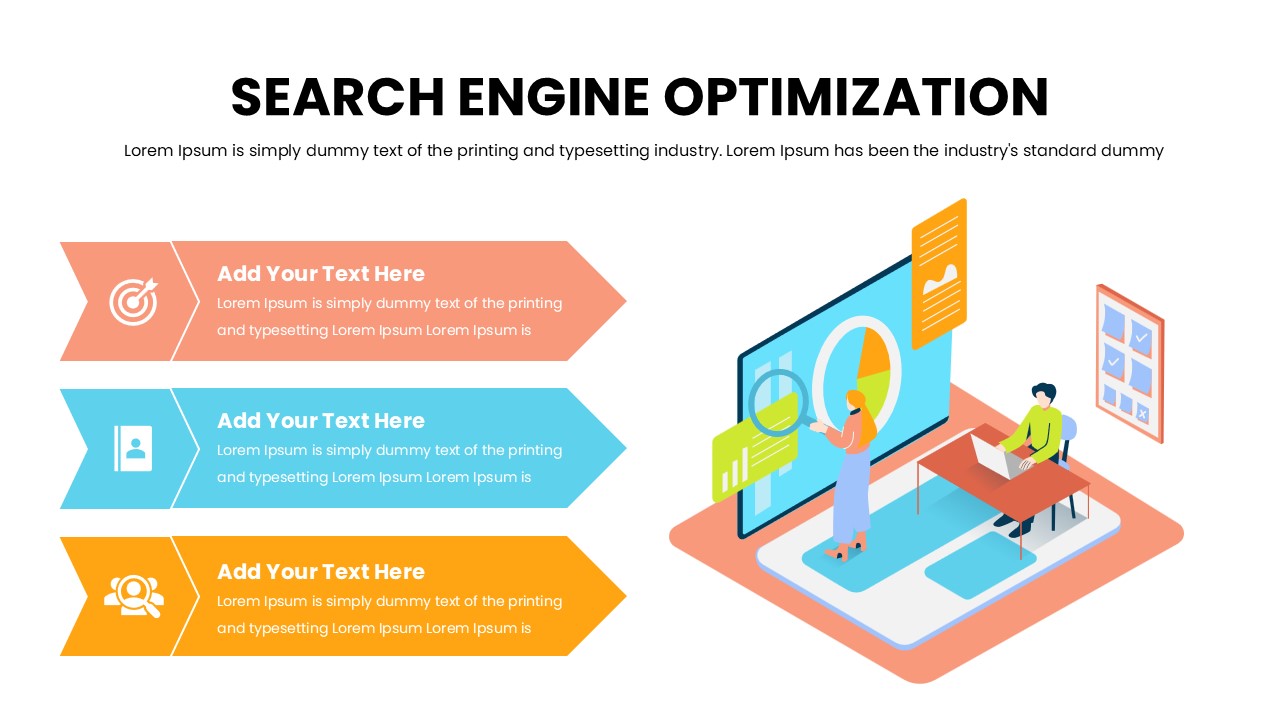
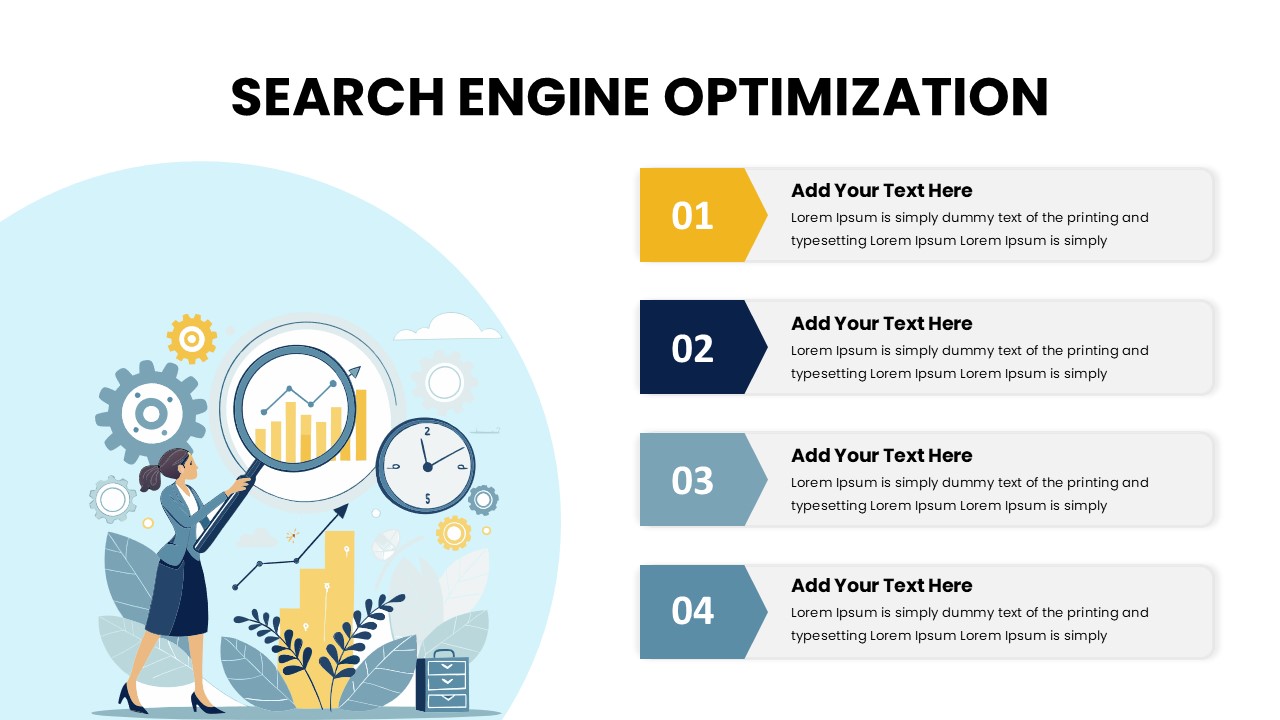
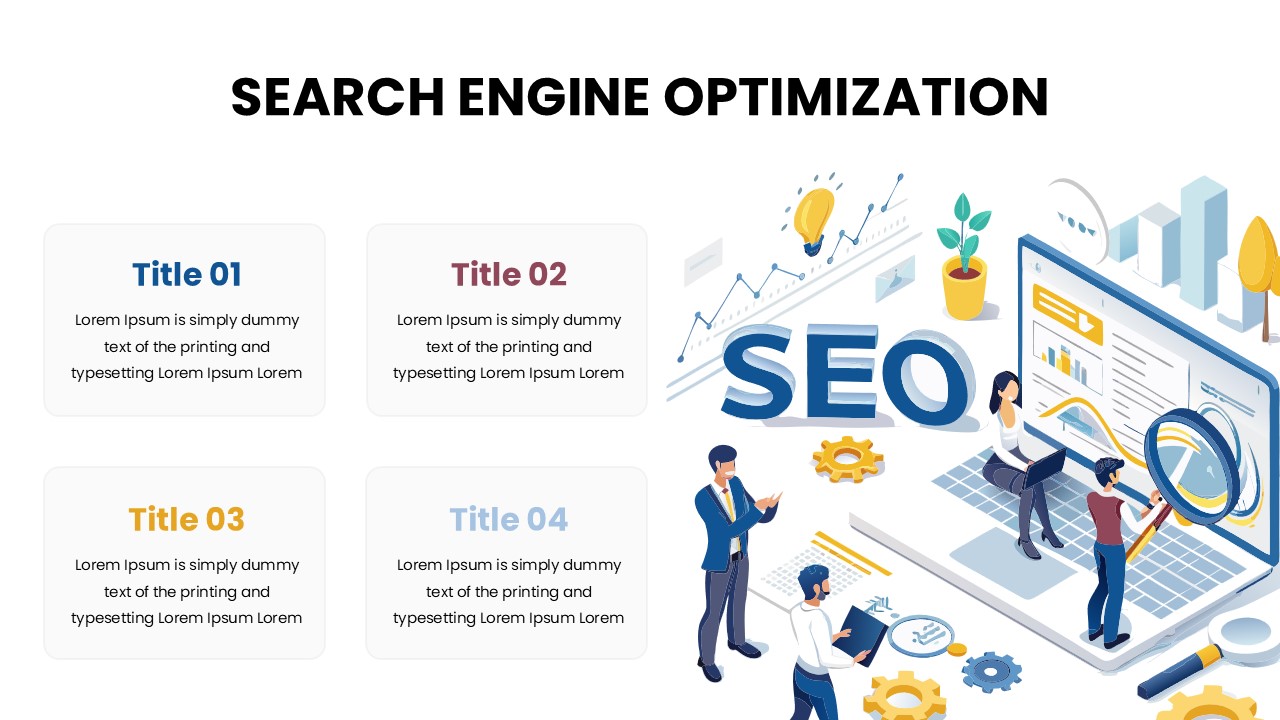
The layout includes multiple infographic styles: line charts, comparison graphs, timelines, spotlight metrics, and clearly labeled KPIs. Small icons help break up text, and clean color schemes let key numbers stand out. No fluff—just visuals that highlight the progress and impact of your SEO strategy.
Good fits for this template include:
- SEO specialists or analysts preparing monthly or quarterly reports.
- Marketing managers needing to show ROI and performance trends.
- Digital agencies who want reports that are something clients look forward to, not dread.
- Freelance SEO consultants explaining strategy or results to non-technical audiences.
- Business owners wanting a view of how their website is performing and what to optimize next.
All slides are 100% customizable. Swap fonts, adjust colors to match your brand, change layouts, or drop in your own metrics/graphs. Since there are five infographic variations, you’ve got flexibility to spotlight different angles—growth over time, competition comparison, or content performance.
Features of this template
- 100% editable and easy to modify
- 4 Different slides to impress your audience
- Contains easy-to-edit resources for your presentations
- Designed to be used in Canva, Google Slides and Microsoft PowerPoint
- Includes information about fonts, colors, and credits of the resources used
Video Preview of SEO Infographics
Share Now!
Presentation Tips


Related Products

Same Contributor


Featured Products