Research Project Infographics
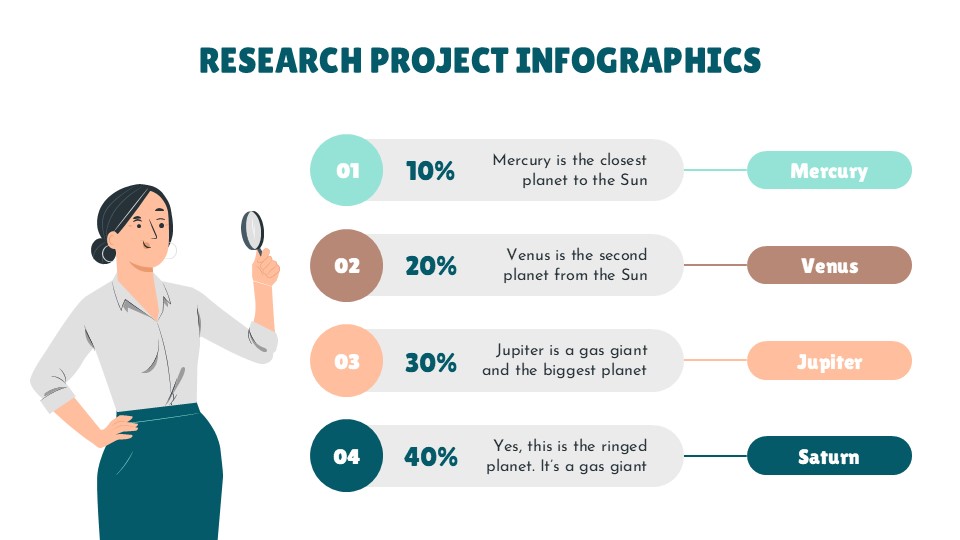
Research Project Infographics
Free PowerPoint template and Google Slides theme
Tired of your research data getting lost in a sea of text? Our “Research Project Infographics” template is the visual solution you’ve been looking for! This outstanding Google Slides theme and PowerPoint template isn’t just a design, it’s a strategically crafted tool to transform your complex research findings into clear, compelling, and instantly engaging visual stories.
>>> Research Project Proposal PowerPoint Template
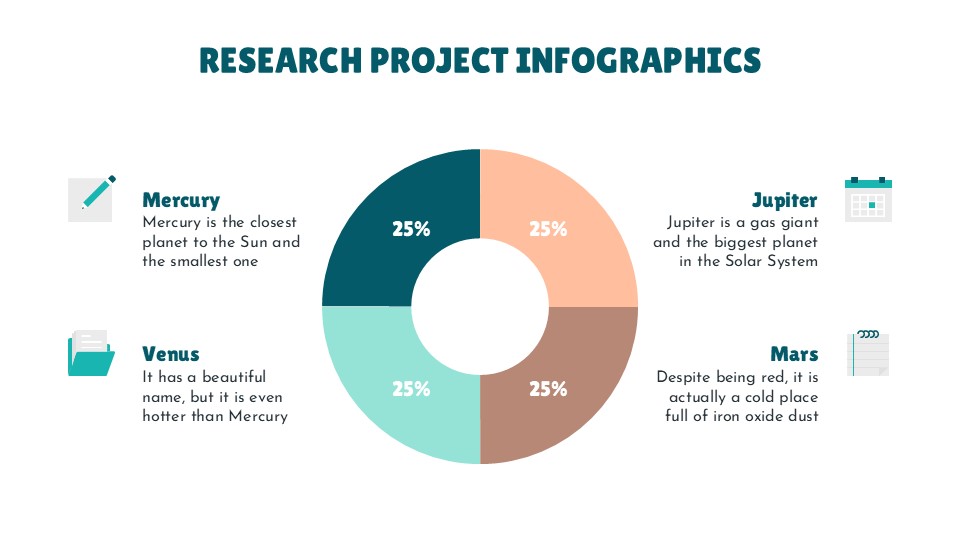
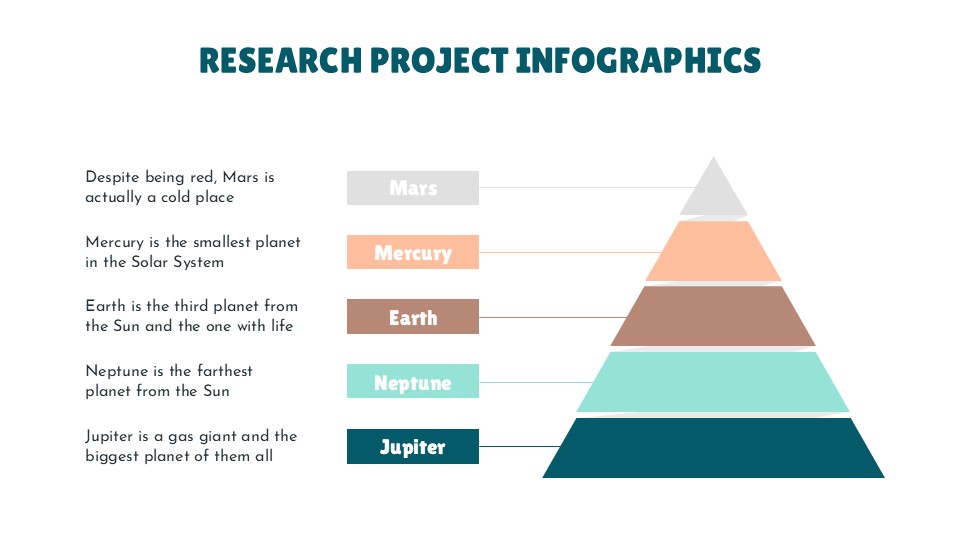
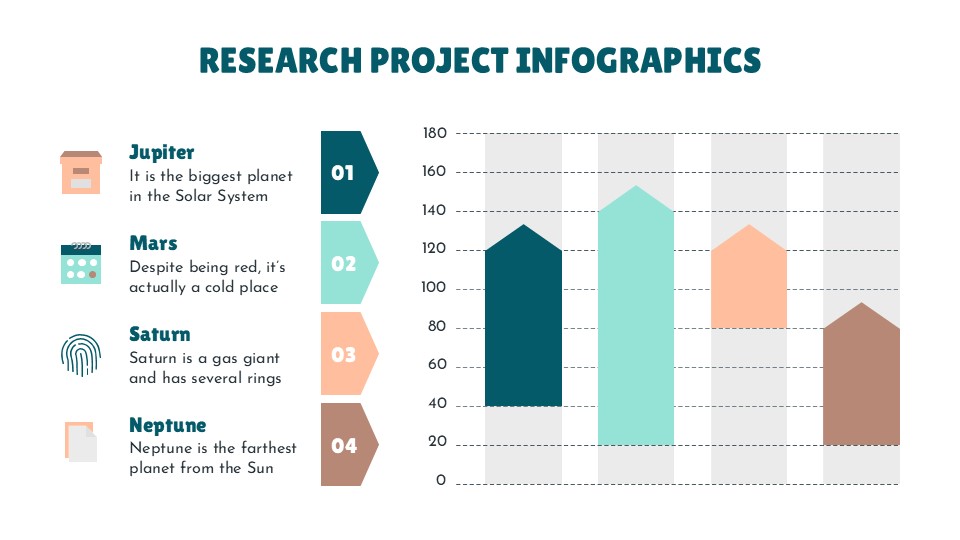
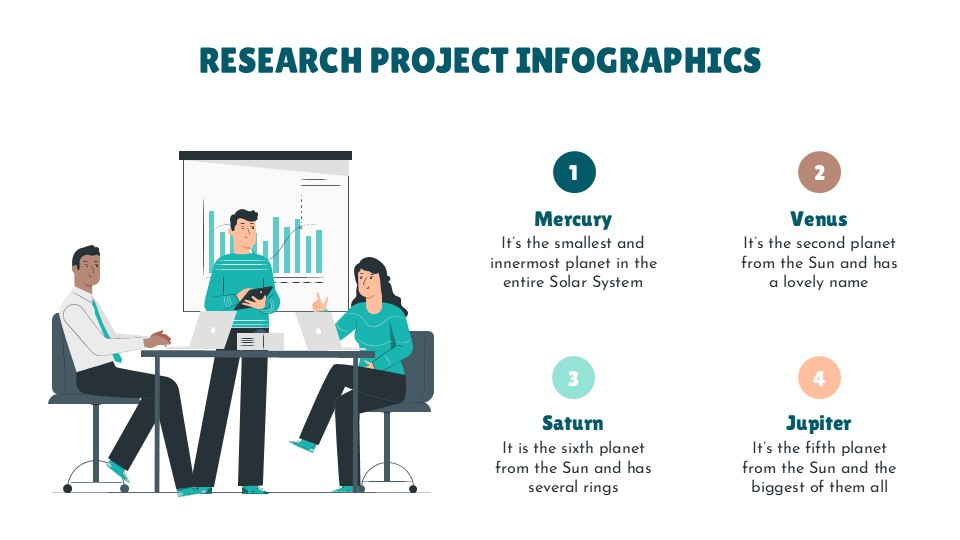
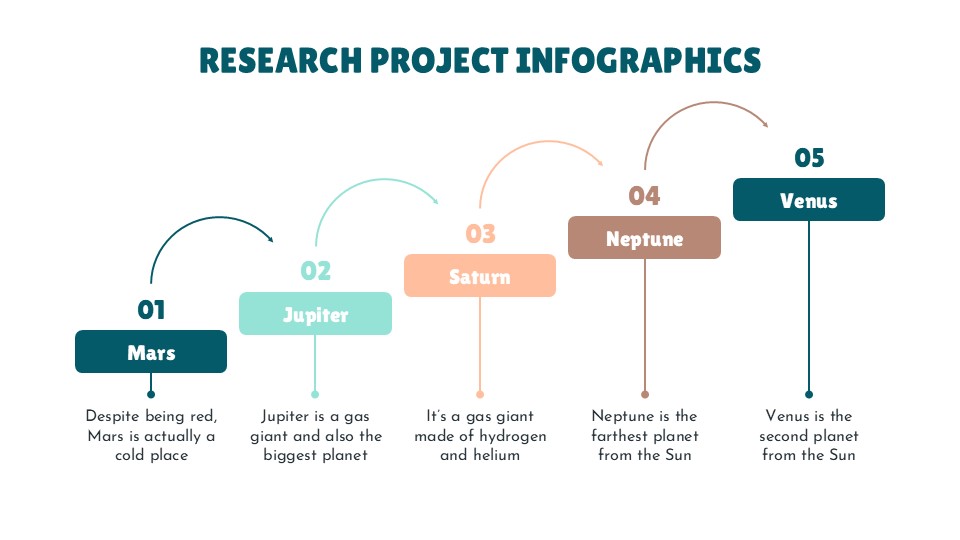
Imagine presenting your data, methodology, and discoveries through 30 meticulously designed, editable infographics, charts, maps, and timelines. The template’s clean, versatile design, with a white background and tasteful illustrations, makes it perfect for any research topic or academic discipline. Its elegant color palette of green, dark blue, and brown adds a professional, trustworthy feel to your presentation.
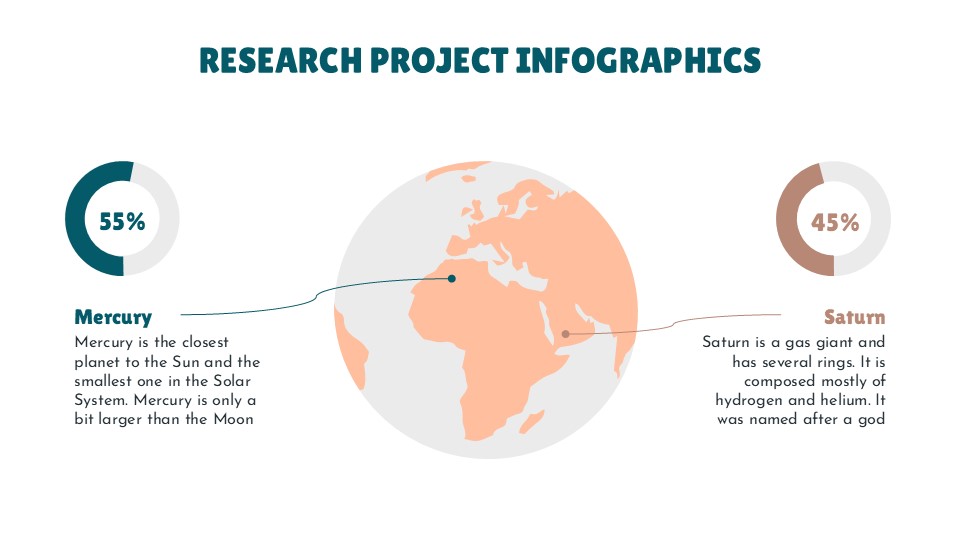
With 100% editability, you have complete control to customize every element. Easily present statistical data, map out your research process, or show geographical distribution—all with a few clicks. The template also includes a rich library of icons and a Flaticon extension, giving you endless options for personalization. It’s designed to be the perfect companion to our “Research Project Proposal” template, allowing you to create a complete and persuasive narrative. Stop just presenting data, start telling a powerful story that makes your audience understand your core discoveries in seconds!
Features of this template
- 100% editable and easy to modify
- 30 Different slides to impress your audience
- Contains easy-to-edit graphics such as graphs, maps, tables, timelines and mockups
- Includes 500+ icons and Flaticon’s extension for customizing your slides
- Designed to be used in Google Slides and Microsoft PowerPoint
- Includes information about fonts, colors, and credits of the resources used
Video Preview of Research Project Infographics
Share Now!
Presentation Tips


Related Products
Same Contributor


Featured Products