KPI Finances Infographics
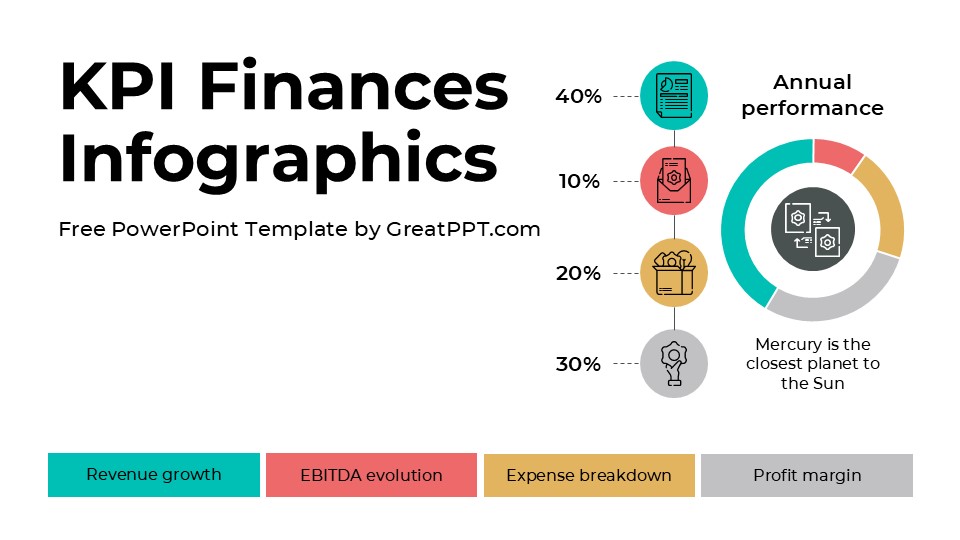

KPI Finances Infographics
Free PowerPoint template and Google Slides theme
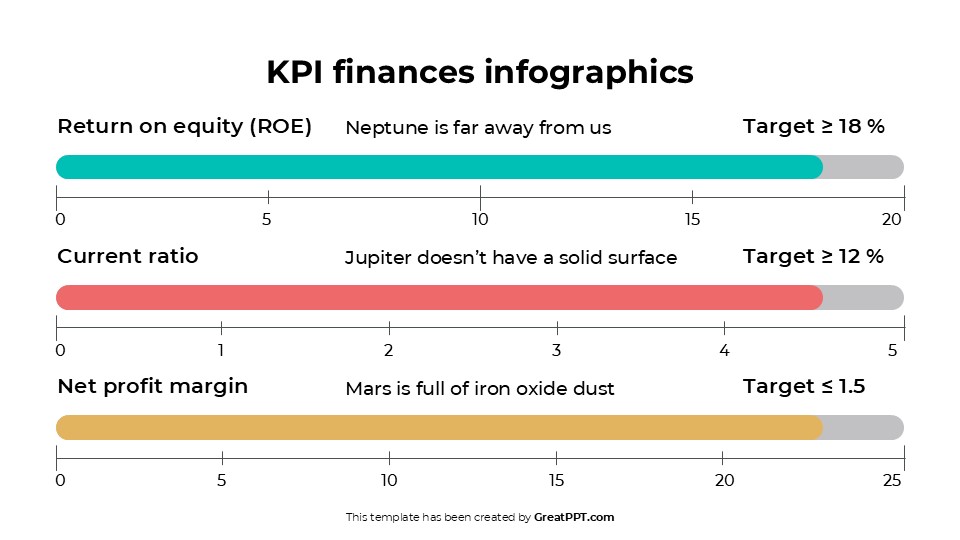
Ready to transform your financial data into a visual masterpiece? Our KPI Finances Infographics Aesthetic template is your essential tool for powerful and persuasive financial presentations! Available as a premium Google Slides theme and PowerPoint template, this isn’t just a basic design—it’s a sophisticated, user-friendly toolkit designed to make your key performance indicators and financial insights effortlessly clear.
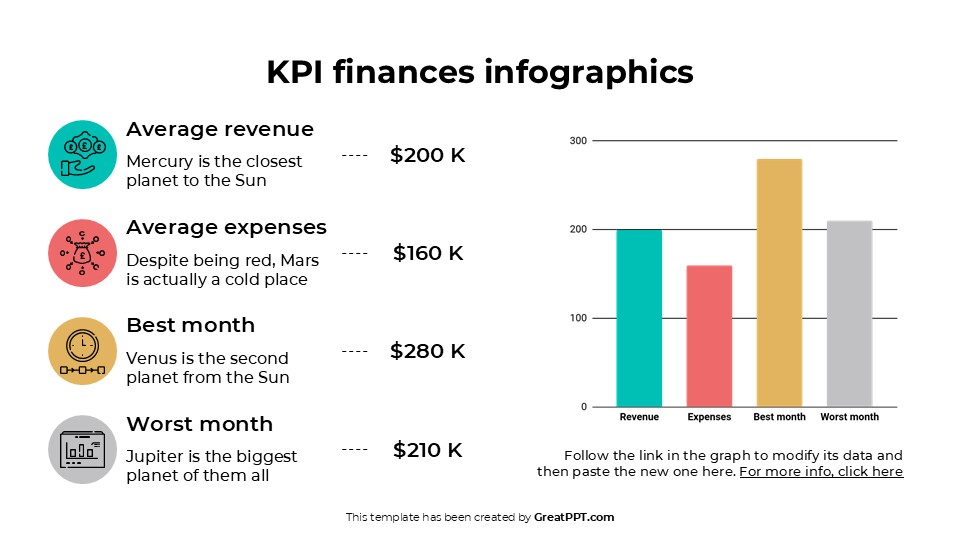
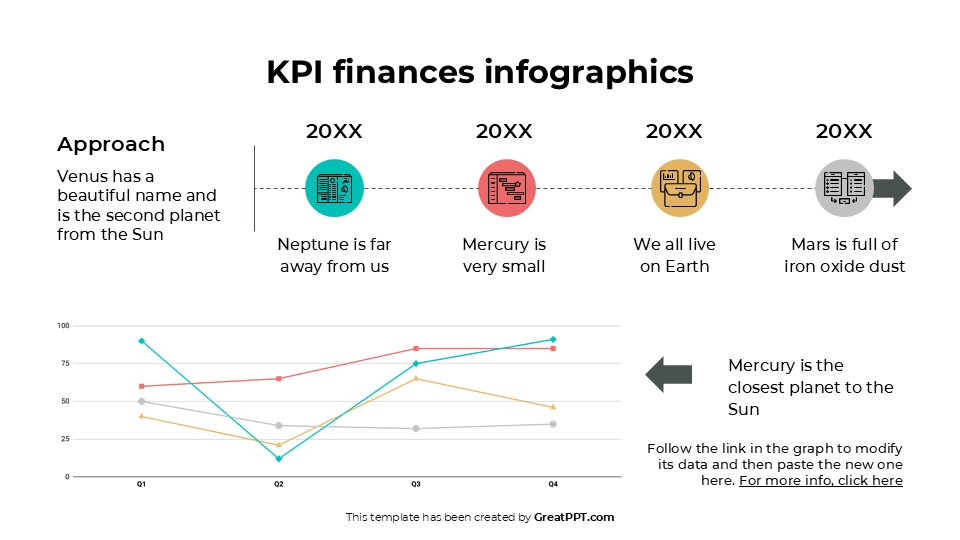
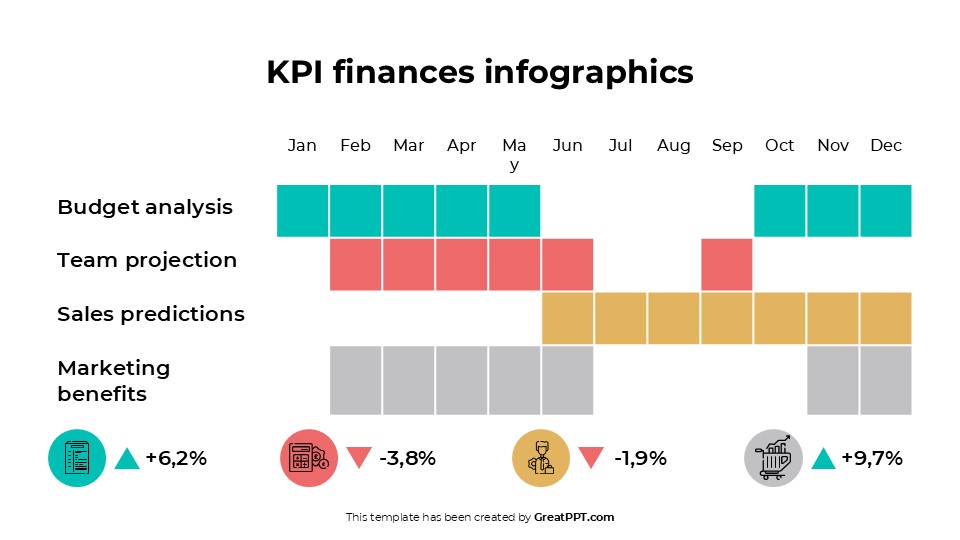
Imagine presenting your business budget and sales analysis with stunning infographics that immediately captivate your audience. This free template helps you move beyond dense spreadsheets, making it easy to organize complex data and showcase it with impact. Whether you’re reporting to the board, pitching to investors, or training your team, these visuals ensure everyone is on the same page and fully understands your financial narrative.
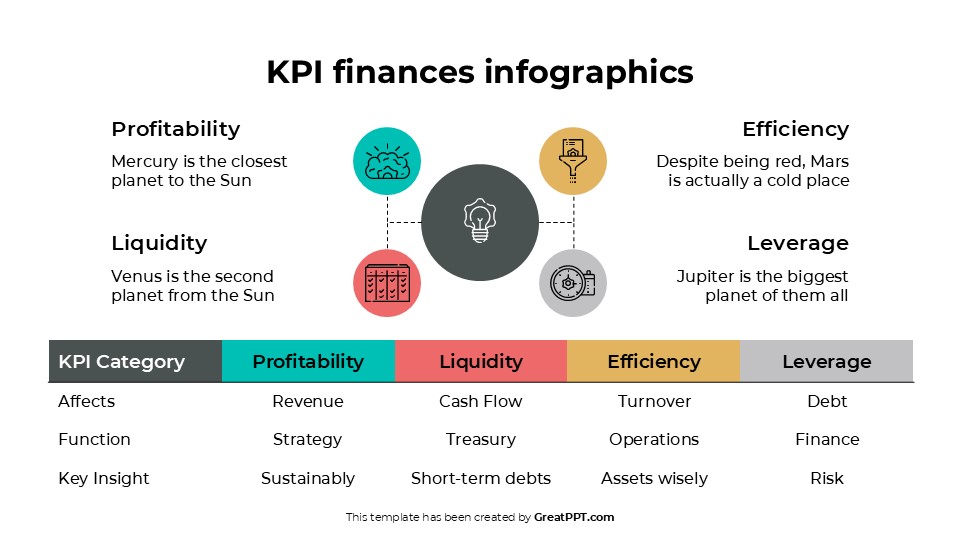
With 100% editable infographics, you have complete creative control to tailor every chart, diagram, and visual element to your specific data and branding. This versatile resource is designed to boost your presentations and can be seamlessly integrated into your existing decks or used as standalone, powerful visuals. Stop telling them about your numbers, show them your success with a template that turns data into a compelling story!
Features of this template
- 100% editable and easy to modify
- 11 Different slides to impress your audience
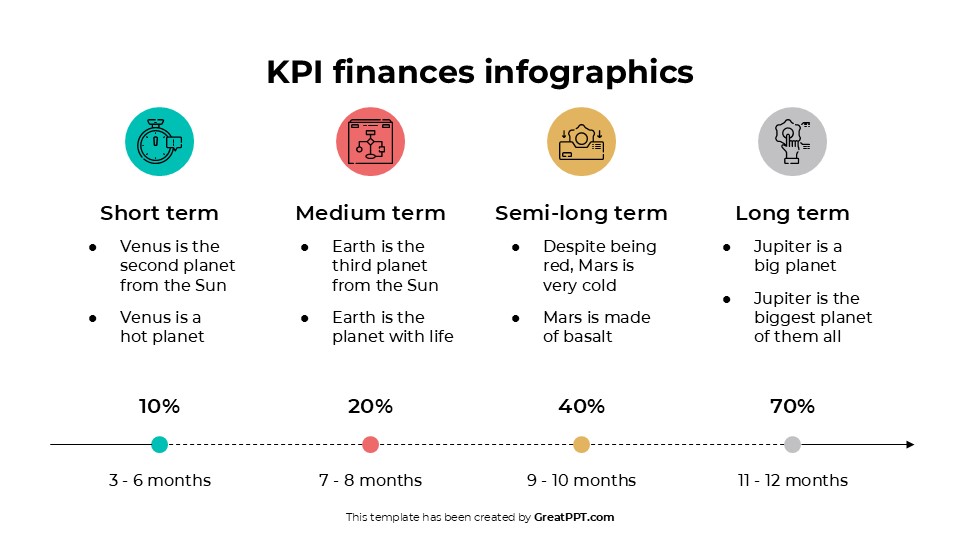
- Contains easy-to-edit graphics such as graphs, maps, tables, timelines and mockups
- Includes 500+ icons and Flaticon’s extension for customizing your slides
- Designed to be used in Google Slides and Microsoft PowerPoint
- Includes information about fonts, colors, and credits of the resources used
Video Preview of KPI Finances Infographics
Share Now!
Presentation Tips


Related Products


Same Contributor


Featured Products