Iran Map Infographics
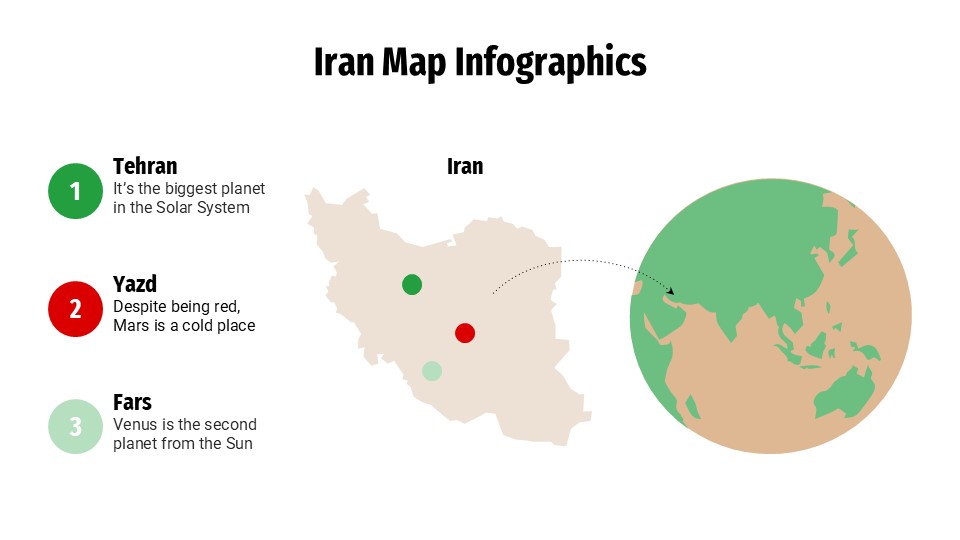
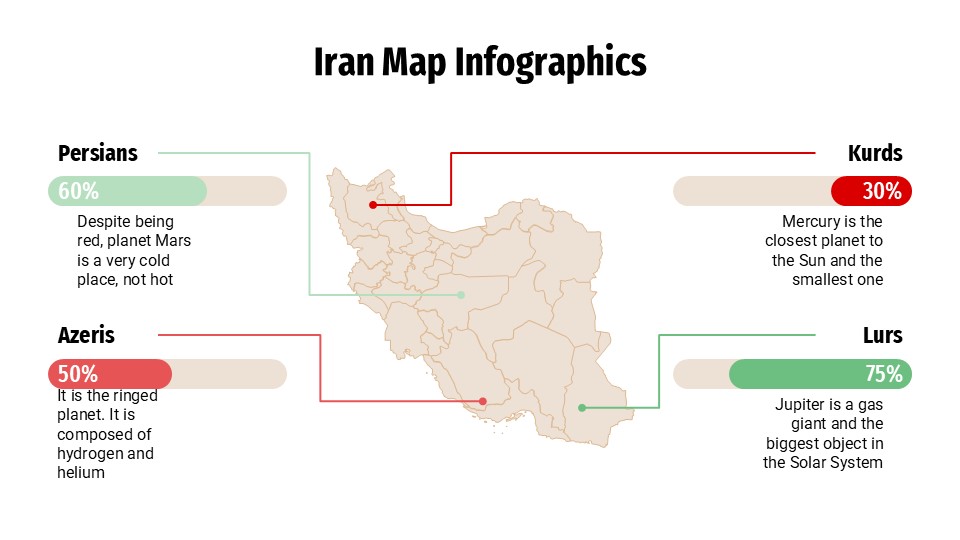
Iran Map Infographics
Free PowerPoint template and Google Slides theme
Explaining regional logistics, market penetration, or geopolitical shifts without a clear visual aid is a recipe for a bored audience. If you’re presenting a market entry strategy for Tehran, analyzing demographic trends across the Iranian plateau, or outlining supply chain routes near the Persian Gulf, you can’t rely on static, low-res images found on a quick search. You need a deck that handles geographical data with surgical precision.
The Iran Map Infographics for Google Slides and PowerPoint is a high-performance toolkit designed to turn complex regional data into a clear, persuasive narrative. It moves away from “text-heavy” slides and puts the focus exactly where it belongs: on the map.
The Aesthetic: Clean, Vector-Sharp, and Professional
This isn’t just a map; it’s a fully scalable design system. The visual identity is built for clarity and impact:
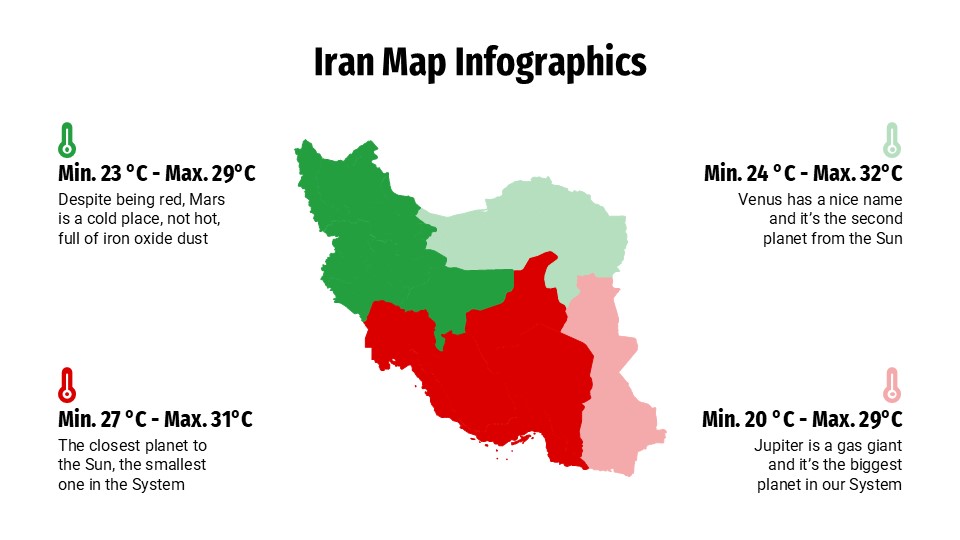
The “Authority” Palette: The template utilizes a professional mix of navy blues, forest greens, and slate grays. These high-contrast colors aren’t just for looks—they are designed to make specific provinces or data points pop, even on a grainy projector.
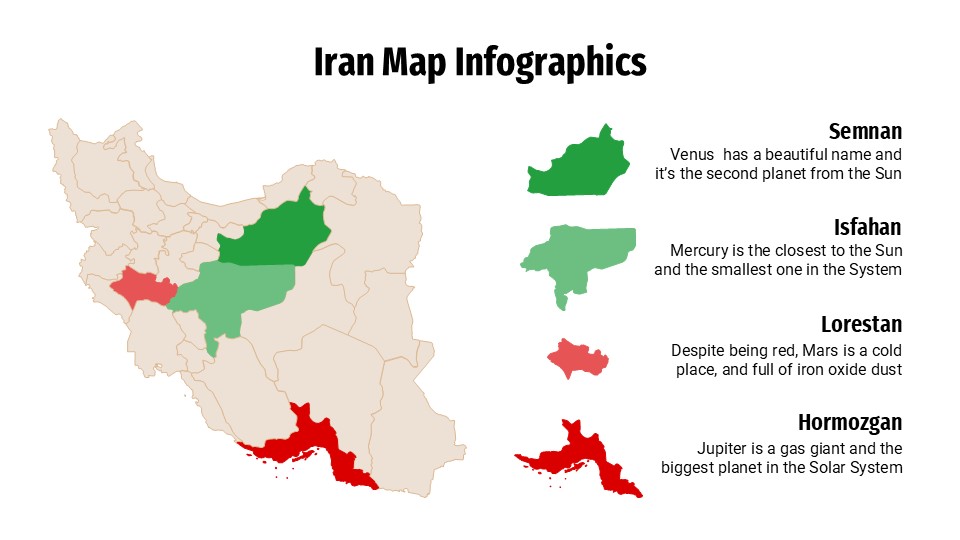
100% Vector Precision: Every province and administrative boundary is a separate, editable shape. This means you can change the color of the Isfahan region or zoom in on the Caspian coastline without losing a single pixel of quality.
Iconic Integration: From oil rigs and shipping containers to population silhouettes, the template includes a massive library of specialized icons that let you “label” your map with zero clutter.
Purpose & Tactical Use Cases
This is a Geographical Strategy Kit built for anyone operating in or analyzing the Iranian market:
Business Expansion & GTM Strategy: Perfect for international trade managers visualizing sales territories, distribution hubs, or local consumer demographics.
Geopolitical & Academic Research: Ideal for professors or analysts breaking down regional voting patterns, resource distribution, or historical migration routes.
Logistics & Infrastructure Planning: Use the “Node and Path” infographics to map out pipeline projects, railway networks, or port capacities in Bandar Abbas.
NGO & Health Reports: A go-to resource for tracking aid distribution or public health metrics across various provinces in real-time.
Features of this template
- 100% editable and easy to modify
- 30 Different slides to impress your audience
- Contains easy-to-edit graphics such as graphs, maps, tables, timelines and mockups
- Includes 500+ icons for customizing your slides
- Designed to be used in Google Slides, Microsoft PowerPoint & Canva
- Includes information about fonts, colors, and credits of the resources used
Video Preview of Iran Map Infographics
Share Now!
Presentation Tips


Related Products

Same Contributor


Featured Products