Fishbone Diagram Template

Fishbone Diagram Template
Free PowerPoint template and Google Slides theme
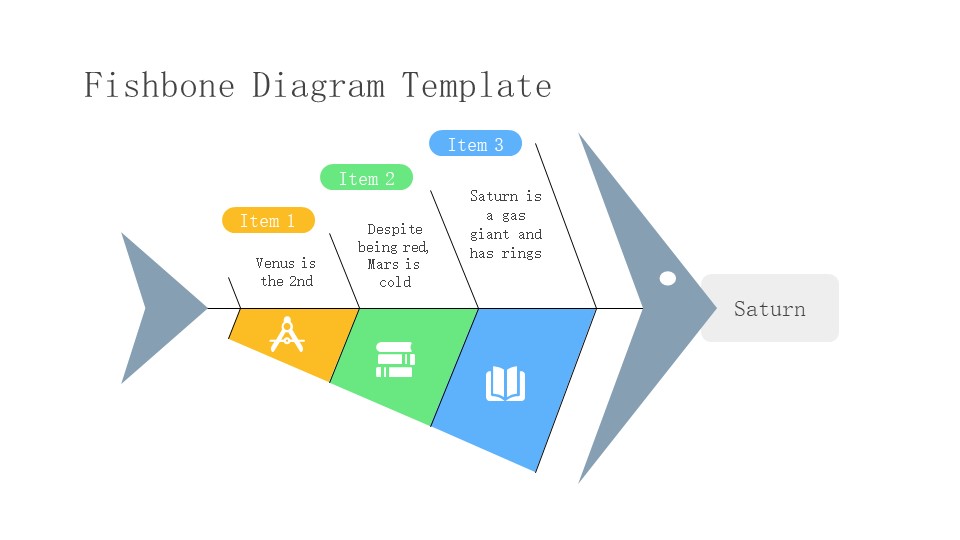
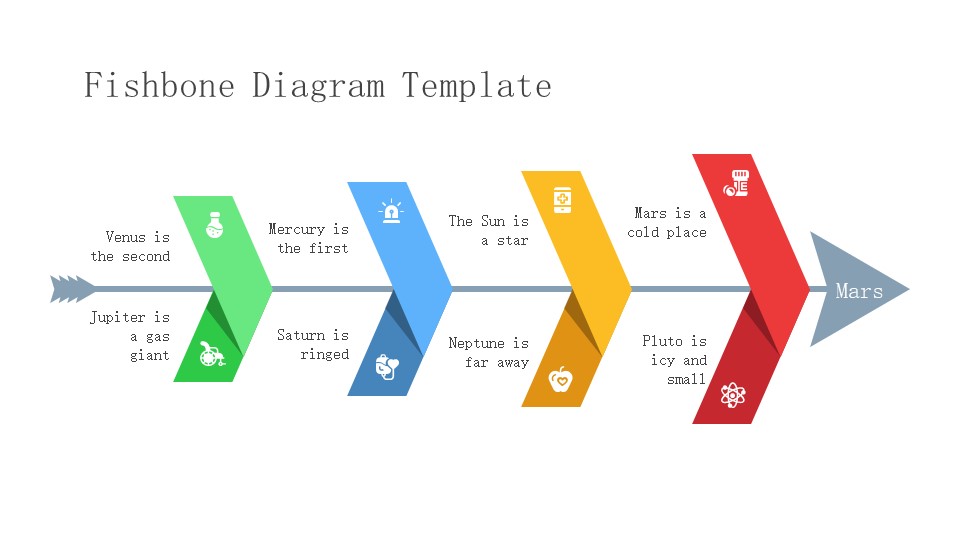
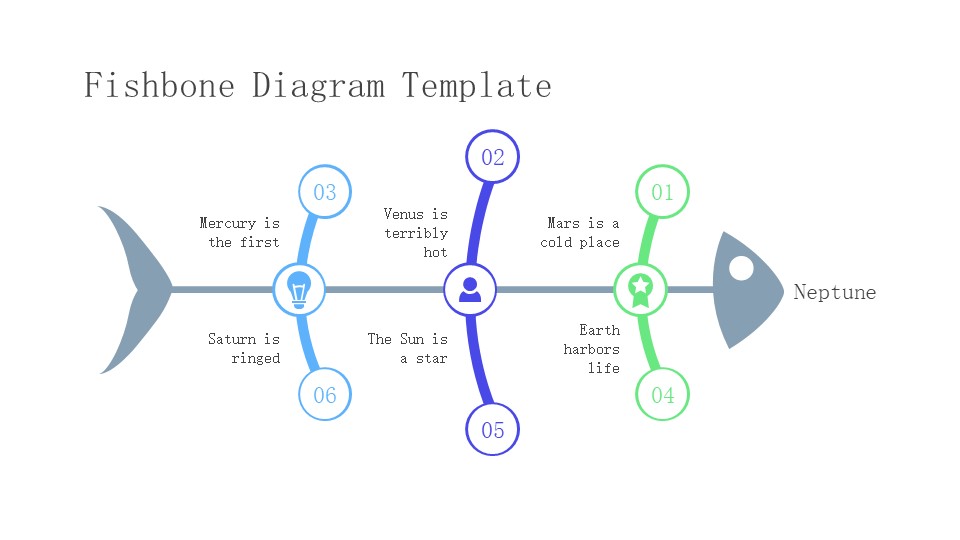
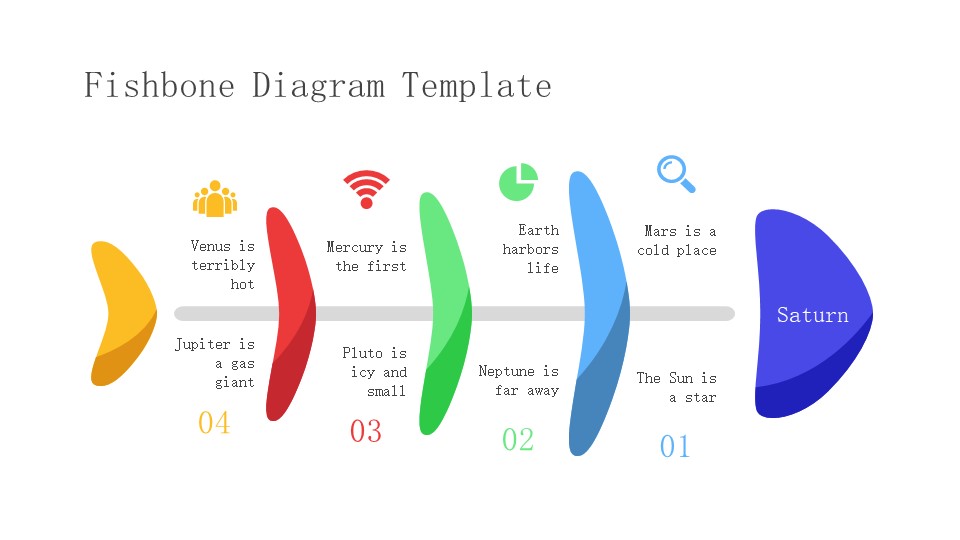
Fishbone diagrams, also known as Ishikawa diagrams, are powerful visual representations. More than often, they help to identify the possible causes of an issue. The problem is placed as the head of the fishbone, while the spines represent the roots of the obstacle. They can be used to prevent risks.
We have created some cool fishbone diagrams for you! There are different designs for you to choose. Some of them resemble fish, others look like arrows. Aren’t they great? As usual, you’ll find different icons and colors (red, blue, yellow, green) to meet your needs. Of course, you can edit them!
Features of these infographics
- Templates with plenty of fishbone diagrams
- 100% editable and easy to modify
- 30 different infographics to boost your presentations
- Include icons and Flaticon’s extension for further customization
- Designed to be used in Google Slides, Microsoft PowerPoint and Keynote
- 16:9 widescreen format suitable for all types of screens
- Include information about how to edit and customize your infographics
Share Now!
Presentation Tips


Related Products


Same Contributor


Featured Products