Financial Infographics
Financial Infographics
Free PowerPoint template and Google Slides theme
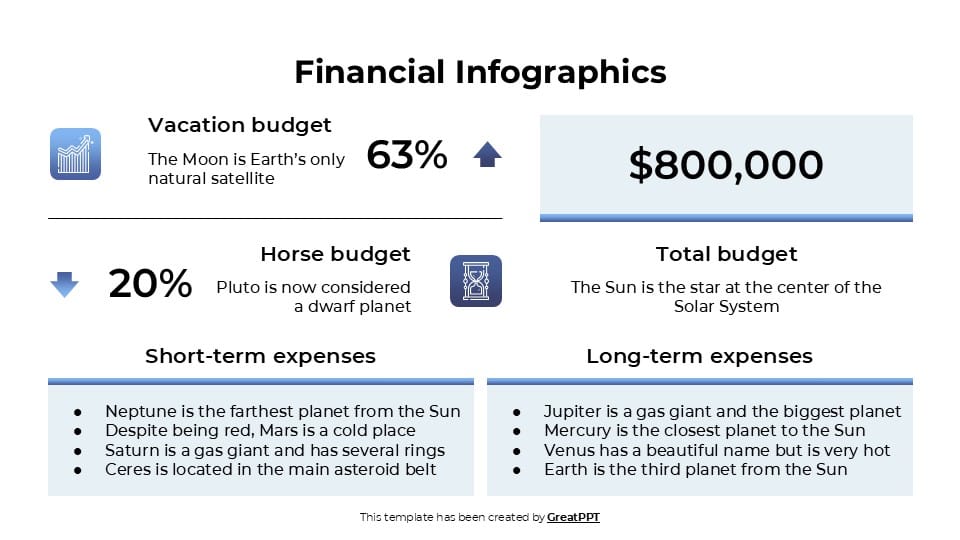
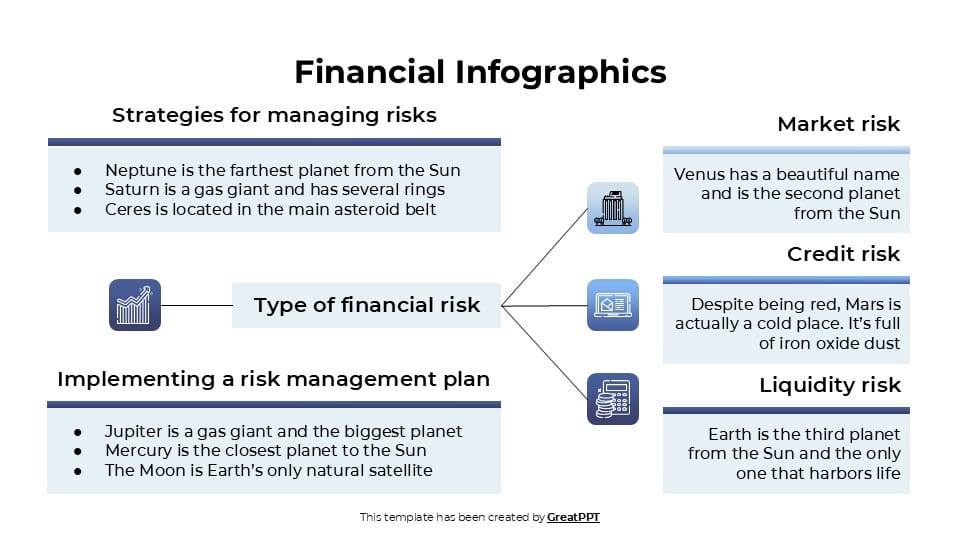
The Financial Infographics template is a professional and visually compelling tool designed to help you present complex financial data with clarity and impact. Ideal for business reports, investment pitches, budget planning, or economic analysis, these slides feature clean layouts, modern icons, charts, and graphs. Each infographic is fully editable, allowing you to customize figures, colors, and styles to match your branding or presentation goals. Compatible with PowerPoint and Google Slides, this template enables financial professionals, analysts, and educators to effectively communicate key metrics, forecasts, and trends in a visually engaging and easy-to-understand format.
Features of this template
- 100% editable and easy to modify
- Different slides to impress your audience
- Contains easy-to-edit graphics such as graphs, maps, tables, timelines and mockups
- Includes 500+ icons and Flaticon’s extension for customizing your slides
- Designed to be used in Google Slides and Microsoft PowerPoint
- Includes information about fonts, colors, and credits of the resources used
Video Preview of Financial Infographics
Share Now!
Presentation Tips


Related Products


Same Contributor


Featured Products