Data Analysis Meeting Presentation
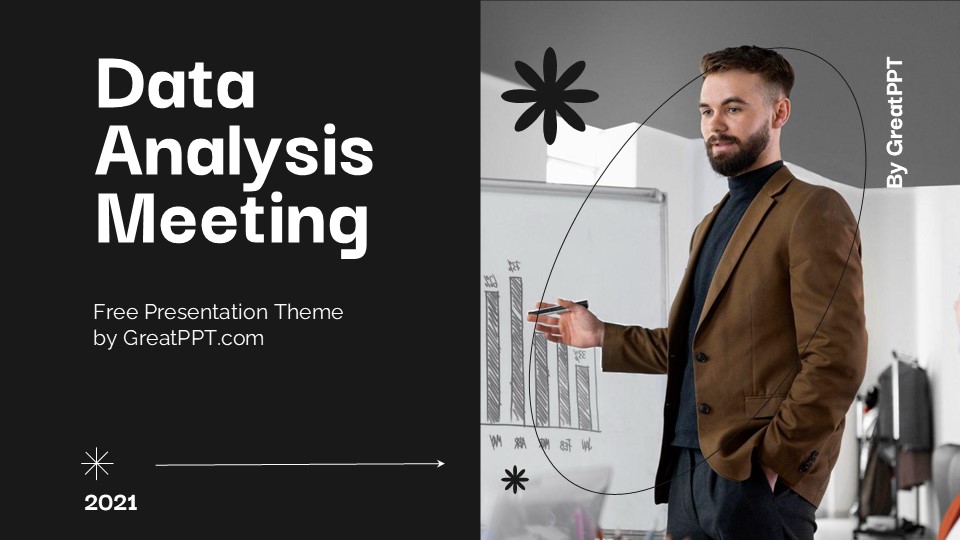


Data Analysis Meeting Presentation
Free PowerPoint template and Google Slides theme
Most data meetings are where enthusiasm goes to die. We’ve all been there—staring at a wall of microscopic spreadsheet cells while someone drones on about “synergy.” If you want your insights to actually drive a decision, you have to stop presenting numbers and start telling stories. You need a deck that translates raw metrics into a strategic roadmap that even the least “techy” person in the room can follow.
The Data Analysis Meeting template for Google Slides and PowerPoint is a high-caliber asset designed for the modern professional. It moves away from the sterile, overcrowded look of traditional reports and settles into a vibrant, highly structured, and human-centric aesthetic that turns every meeting into a breakthrough session.
The Aesthetic: Vibrant Professionalism & Fluid Design
This isn’t just a reporting tool; it’s a Visual Command Center. The design language is built on the concept of “Actionable Intelligence”:
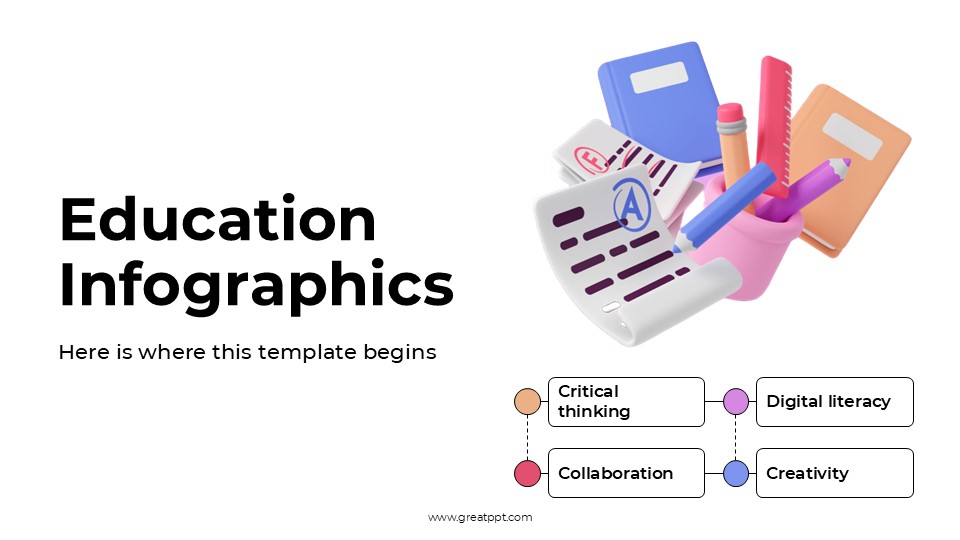
The “Dynamic Data” Palette: Featuring a sophisticated mix of energetic violets, deep teals, and soft lilacs, grounded by plenty of clean white space. This isn’t just about looking good—these colors are high-contrast, making your charts and trendlines pop even on a grainy conference room projector.
Modern Geometric Accents: The slides utilize rounded shapes and fluid organic lines. This softens the “hardness” of data, making complex information feel more approachable and less intimidating for stakeholders.
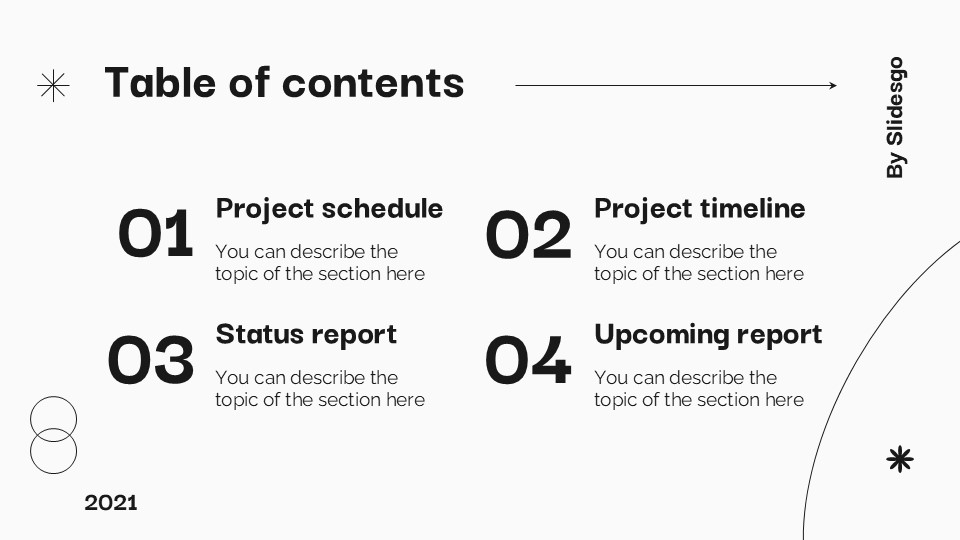
Information Hierarchy: By using bold, oversized headers paired with a clean, modern sans-serif typeface, the template ensures your “Bottom Line” is never buried in the fine print.
Design Logic: Built for Collaborative Decision-Making
The structural logic behind this template focuses on Clarity and Consensus:
The “Insight-First” Framework: Instead of just dumping graphs, these layouts are designed to highlight the implications of the data. Specialized slides allow you to frame a problem, show the supporting evidence, and propose a solution in one cohesive flow.
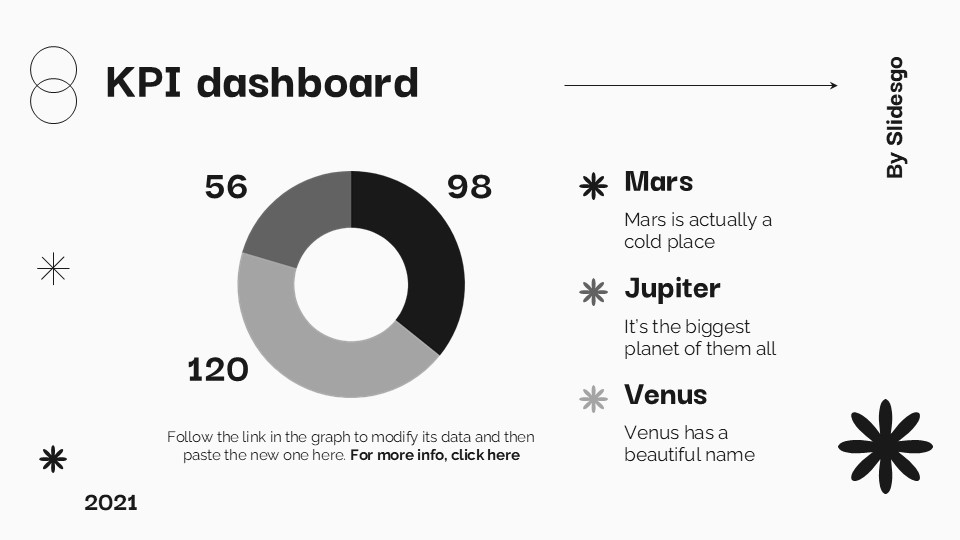
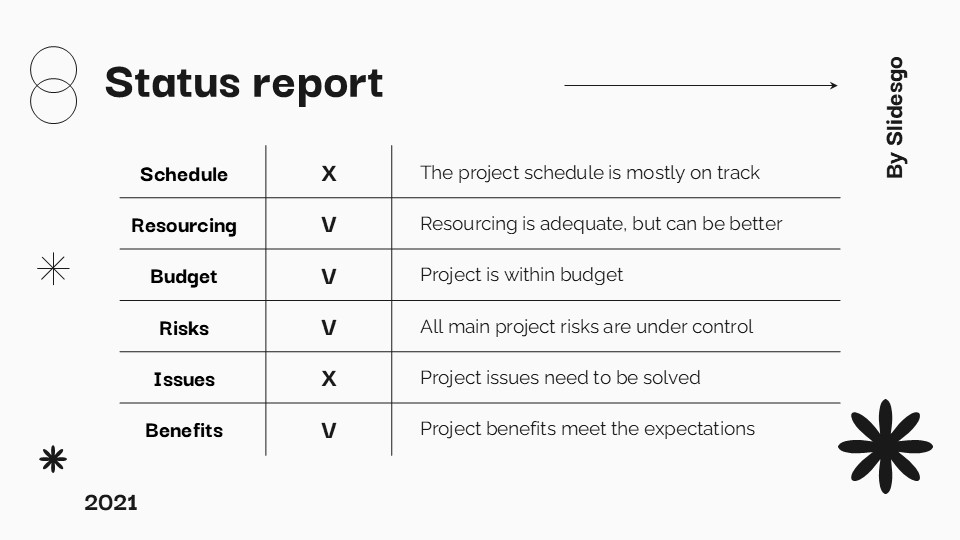
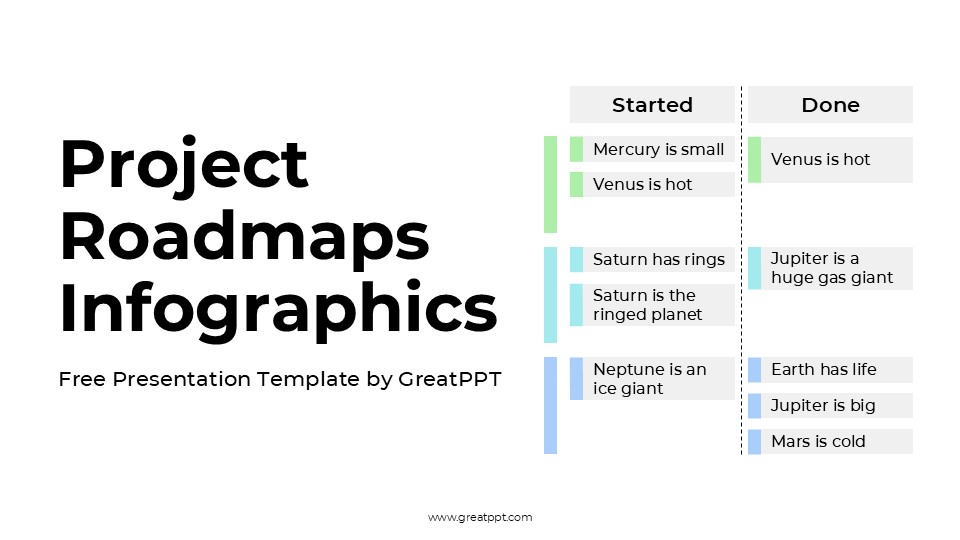
Versatile Data Visualization: We’ve moved beyond basic bar charts. This deck includes integrated dashboard views, comparative percentage breakdowns, and process flowcharts that allow you to show the why behind the numbers.
Interactive Elements: With dedicated sections for Q&A, brainstorming, and “Next Steps,” the template transforms a passive presentation into an active workshop.
Strategic Use Cases: Beyond the Spreadsheet
This is a High-Performance Communication Toolkit built for the drivers of organizational growth:
Monthly & Quarterly Performance Reviews: Perfect for marketing managers or sales leads who need to justify budget spends and celebrate wins with objective proof.
Cross-Functional Strategy Sessions: Ideal for project managers who need to align tech teams with business goals by showing clear, data-backed milestones.
Product Health & UX Briefings: A go-to resource for researchers presenting user feedback loops and A/B testing results to design and engineering teams.
Features of this template
- 100% editable and easy to modify
- 24 Different slides to impress your audience
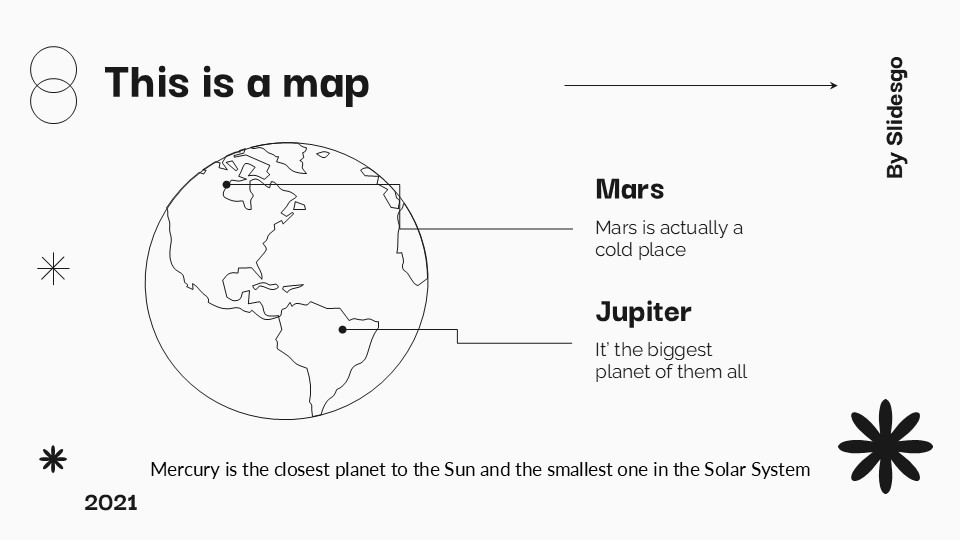
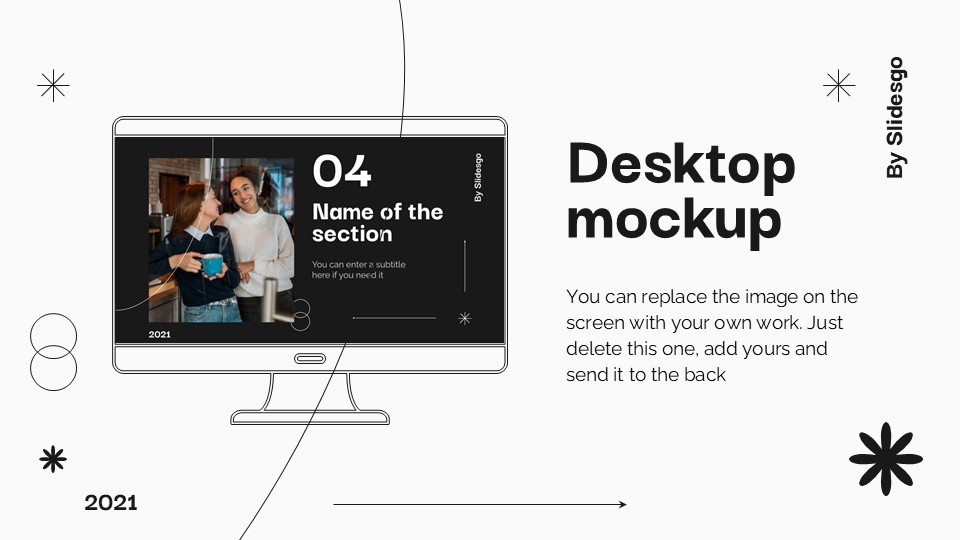
- Contains easy-to-edit graphics such as graphs, maps, tables, timelines and mockups
- Includes 500+ icons for customizing your slides
- Designed to be used in Google Slides, Microsoft PowerPoint & Canva
- Includes information about fonts, colors, and credits of the resources used
Video Preview of Data Analysis Meeting Presentation
Share Now!
Presentation Tips


Recent Templates


Related Products
Same Contributor


Featured Products