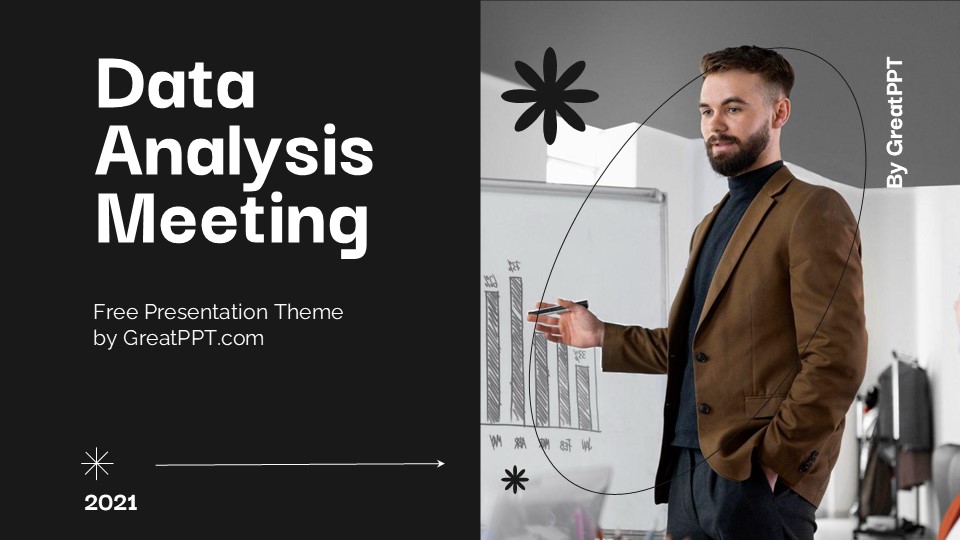
Data Analysis for Business Presentation
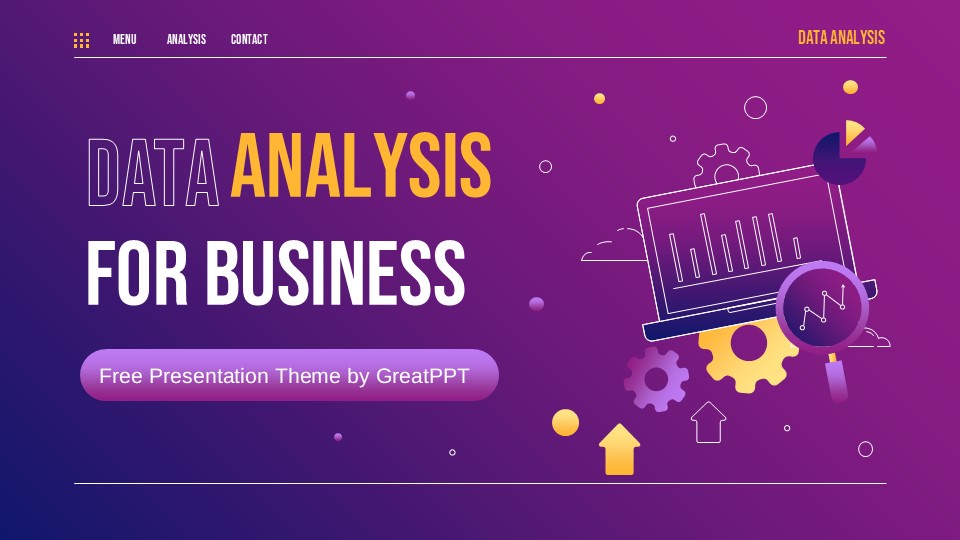
Data Analysis for Business Presentation
Free PowerPoint template and Google Slides theme
Data is just noise until you give it a narrative. In today’s market, being “data-driven” isn’t enough; you have to be “data-articulate.” Whether you’re a business analyst presenting Q3 growth metrics to the board, a marketing strategist justifying a pivot in ad spend, or a consultant breaking down supply chain efficiencies, you need a deck that makes the complex feel intuitive.
The Data Analysis for Business template for Google Slides and PowerPoint is a high-precision toolkit designed for the modern professional. It moves away from cluttered, “math-heavy” slides and settles into a sleek, high-authority aesthetic that turns spreadsheets into actionable stories.
The Aesthetic: Clean Connectivity & Professional Depth
This isn’t just a collection of charts; it’s a Visual Dashboard. The design language is built on the philosophy of “Informed Clarity”:
The “Insight” Palette: Utilizing a sophisticated blend of business blues, slate teals, and light grays. This palette is psychologically designed to convey stability and intelligence, ensuring your audience feels confident in the numbers you’re presenting.
Minimalist UI/UX Influence: The template features thin lines, generous white space, and subtle card-based layouts that mirror modern data software interfaces. It feels “live” and up-to-the-minute, not like a static relic of the past.
Balanced Typography: By pairing bold sans-serif headers with a clean, high-legibility font for data labels, the template ensures that your “Key Performance Indicators” (KPIs) remain the undisputed stars of the show.
Design Logic: Built for the “So What?” Factor
The structural logic behind this template focuses on Analytical Hierarchy and Result-Oriented Pacing:
The “Funnel-to-Fact” Framework: Specialized layouts are designed to guide the audience from broad market trends down to specific, granular insights. It’s perfect for explaining the why behind the what.
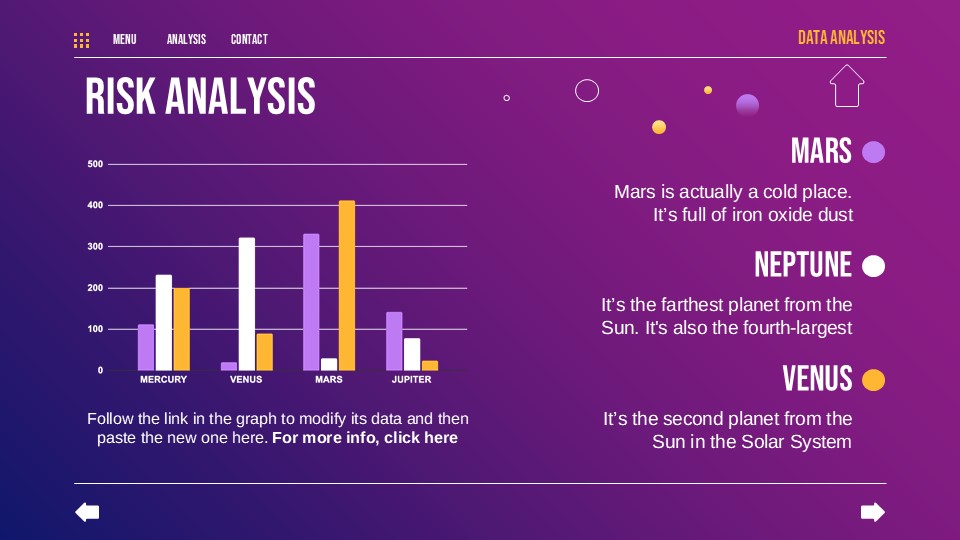
Advanced Visualization Tools: We’ve replaced basic bar charts with integrated dashboards, comparative tables, and heat-map placeholders. This allows you to show correlations—like the relationship between customer churn and seasonal pricing—with surgical precision.
Action-Oriented Closures: The deck includes specific layouts for “Recommendations” and “Next Steps,” ensuring your presentation ends with a clear call to action rather than a confusing data dump.
Strategic Use Cases: Mastering the Boardroom
This is a High-Performance Communication Toolkit built for the architects of business growth:
Quarterly Business Reviews (QBRs): Perfect for department heads who need to showcase achievements and address bottlenecks with objective clarity.
Market Research & Competitive Analysis: Ideal for analysts presenting consumer behavior trends or identifying “blue ocean” opportunities in crowded sectors.
Investment & Financial Briefings: A go-to resource for CFOs and founders who need to demonstrate fiscal health and ROI projections to skeptical stakeholders.
Features of this template
- 100% editable and easy to modify
- 34 Different slides to impress your audience
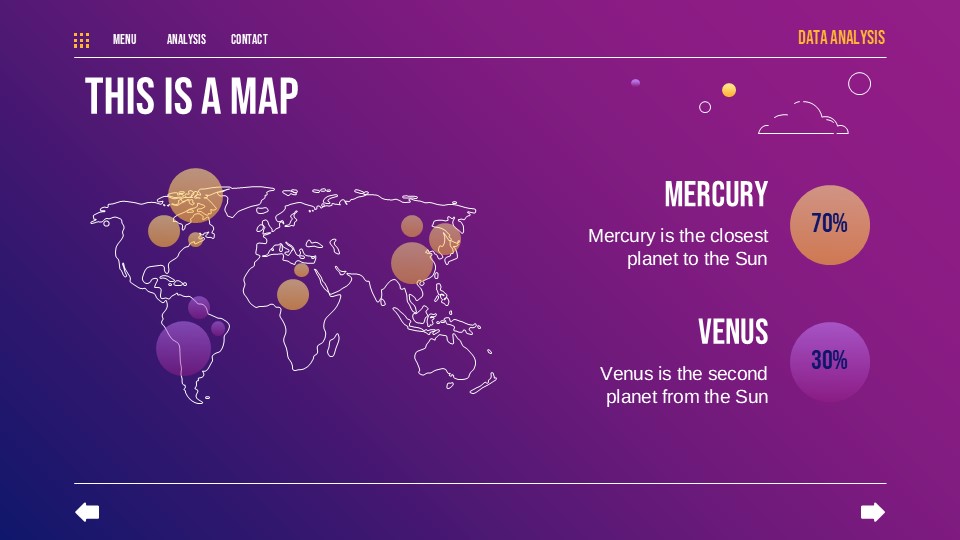
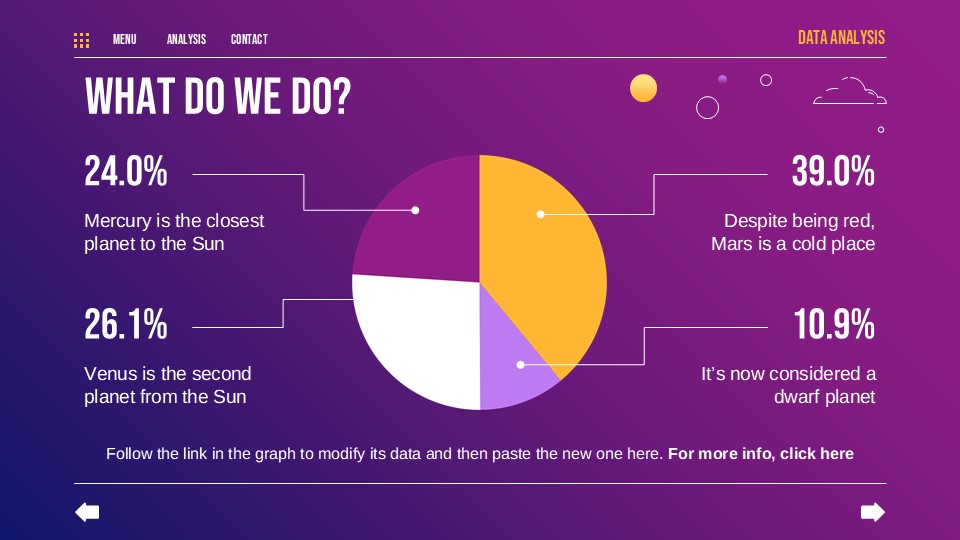
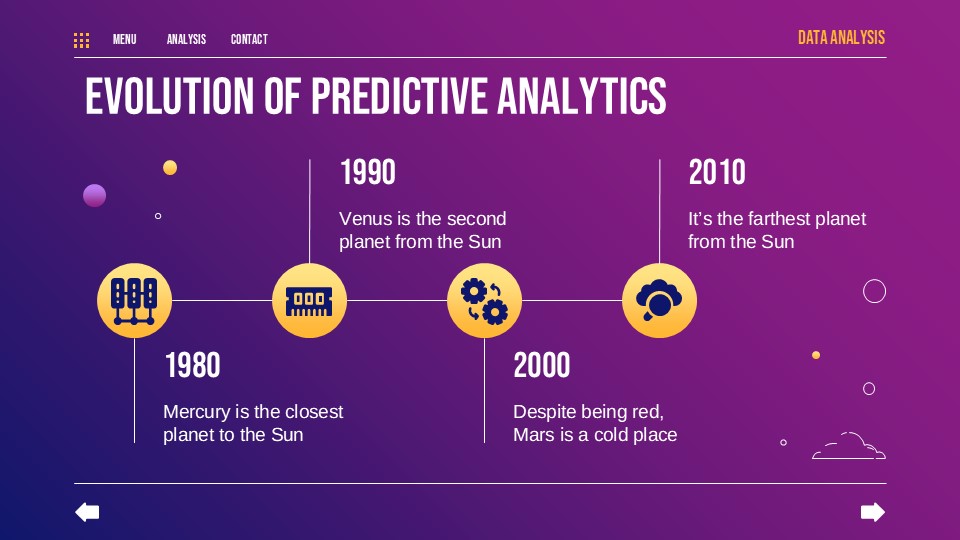
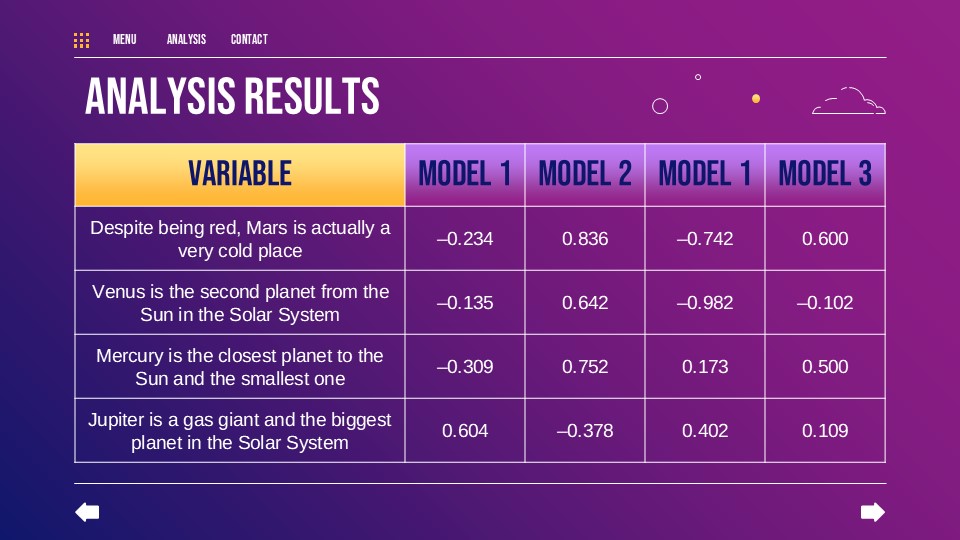
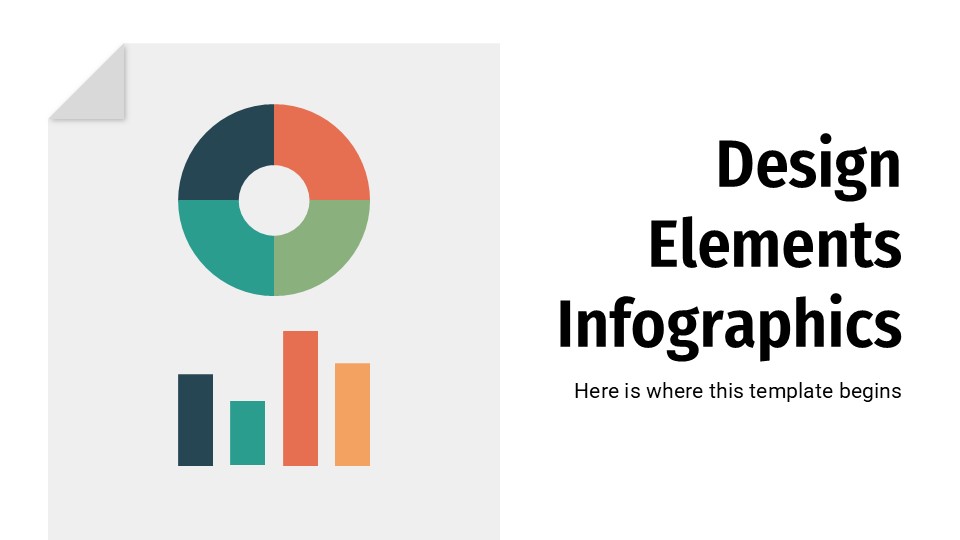
- Contains easy-to-edit graphics such as graphs, maps, tables, timelines and mockups
- Includes 500+ icons for customizing your slides
- Designed to be used in Google Slides, Microsoft PowerPoint & Canva
- Includes information about fonts, colors, and credits of the resources used
Video Preview of Data Analysis for Business Presentation
Share Now!
Presentation Tips


Recent Templates


Related Products
Same Contributor

Featured Products