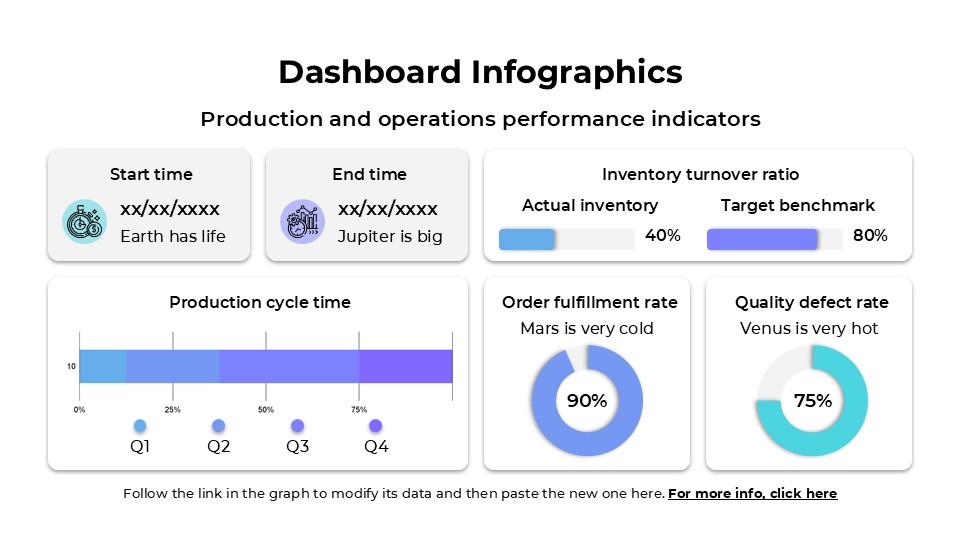
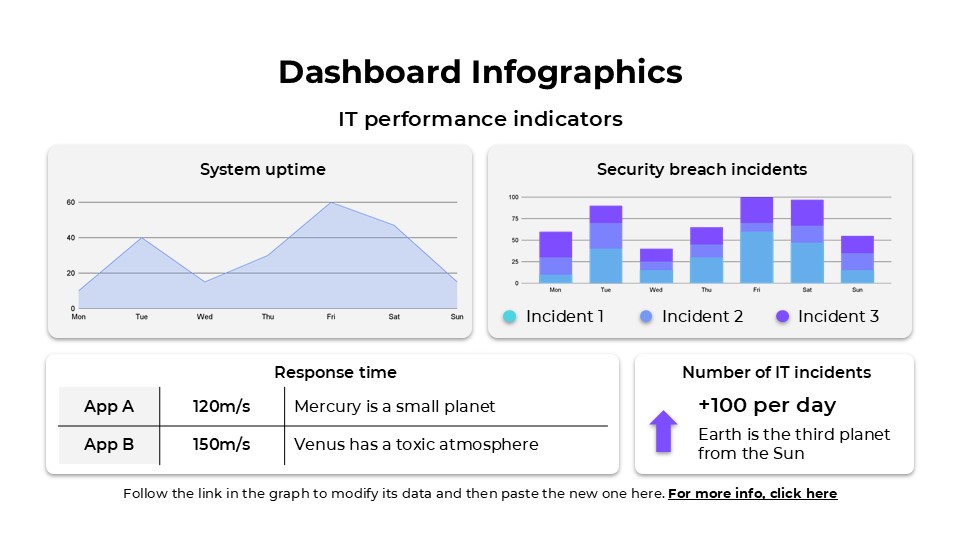
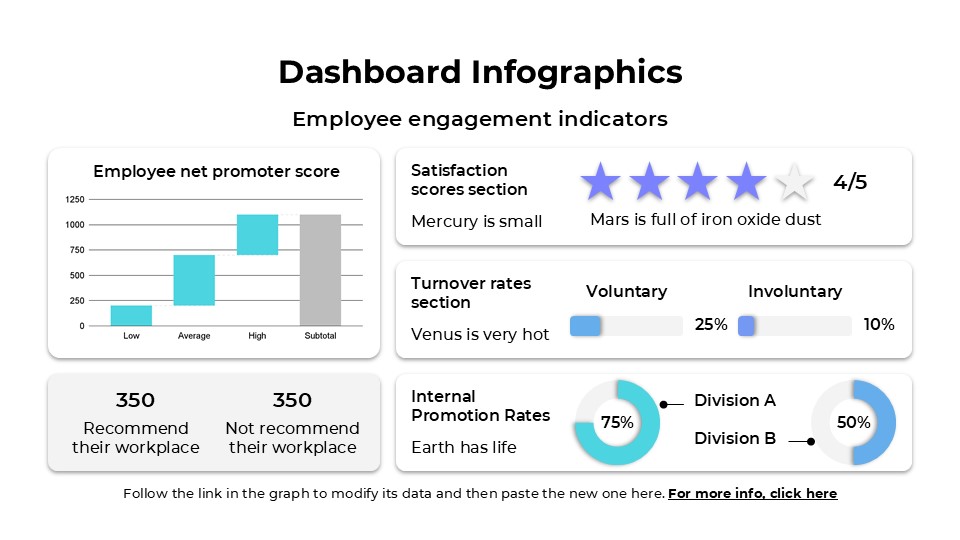
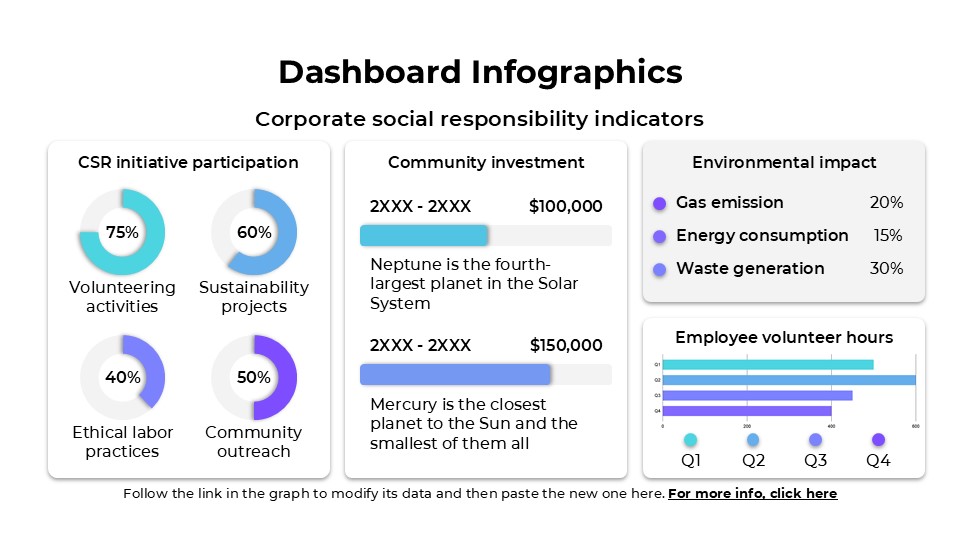
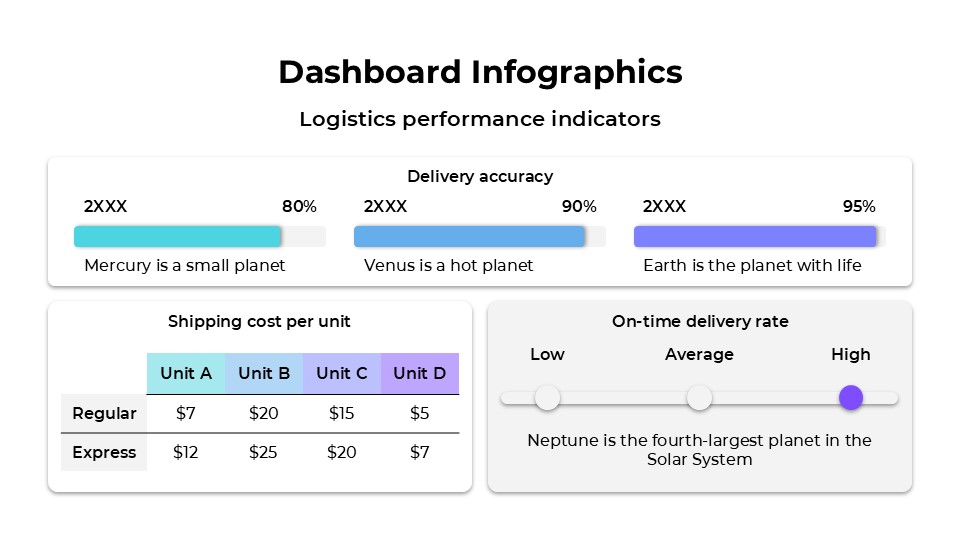
Dashboard Infographics
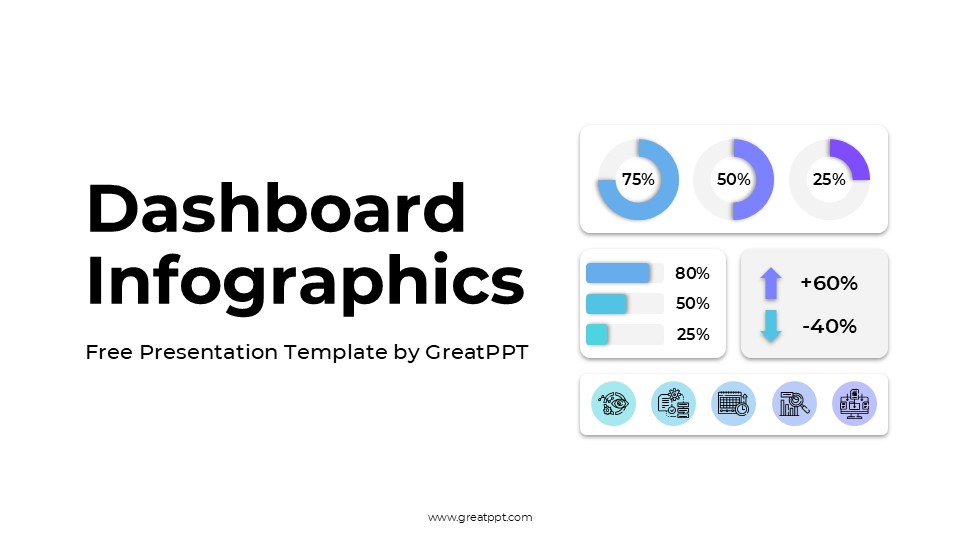
Dashboard Infographics
Free PowerPoint template and Google Slides theme
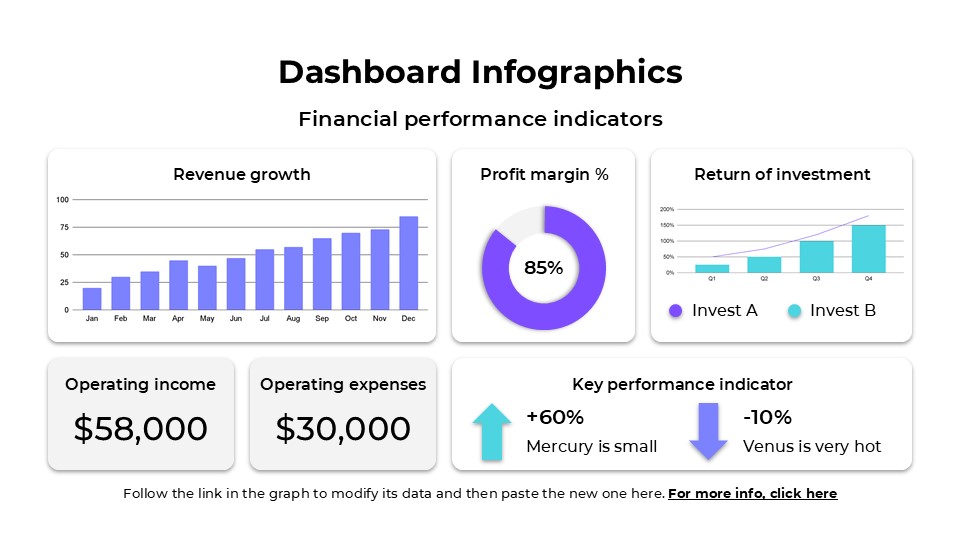
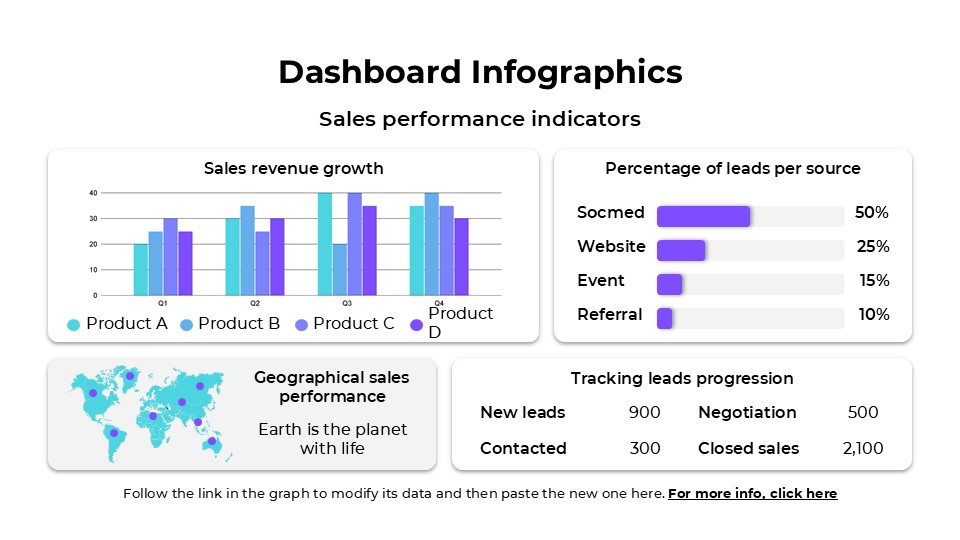
The Dashboard Infographics template is a clean, powerful toolkit built for visualizing business data and performance metrics in a clear, organized way. It’s fully compatible with Google Slides, PowerPoint, and Canva — making it a flexible choice for teams and professionals.
Everything in this template is 100% editable, allowing you to adjust charts, diagrams, timelines, tables, and maps to fit your own data and brand style. The infographic set includes a variety of layouts — from sales dashboards and financial overviews to KPI trackers and project timelines — giving you the structure to present complex data in an intuitive, glance-friendly format.
Features of this template
- 100% editable and easy to modify
- 20 Different slides to impress your audience
- Contains easy-to-edit resources for your presentations
- Designed to be used in Canva, Google Slides and Microsoft PowerPoint
- Includes information about fonts, colors, and credits of the resources used
Video Preview of Dashboard Infographics
Share Now!
Presentation Tips


Related Products


Same Contributor


Featured Products