Data Driven Infographics
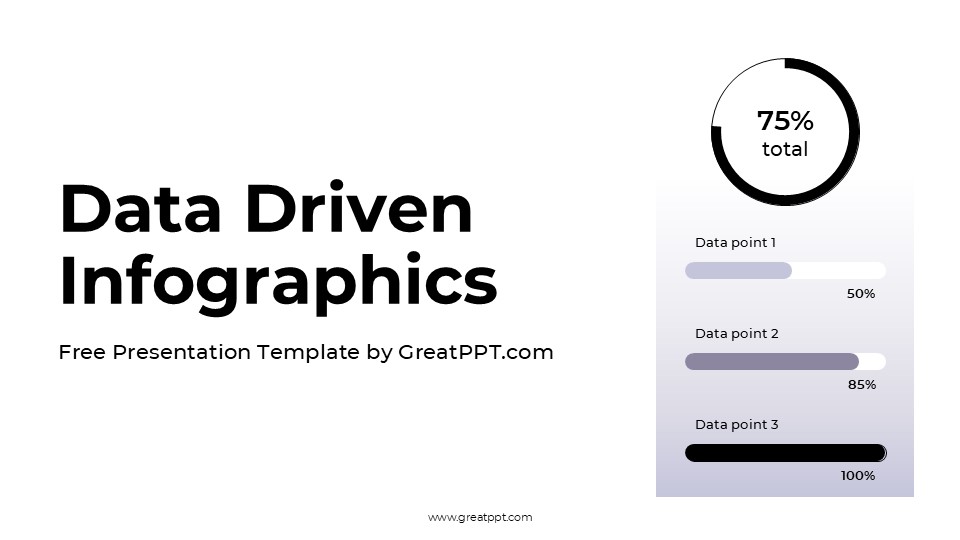
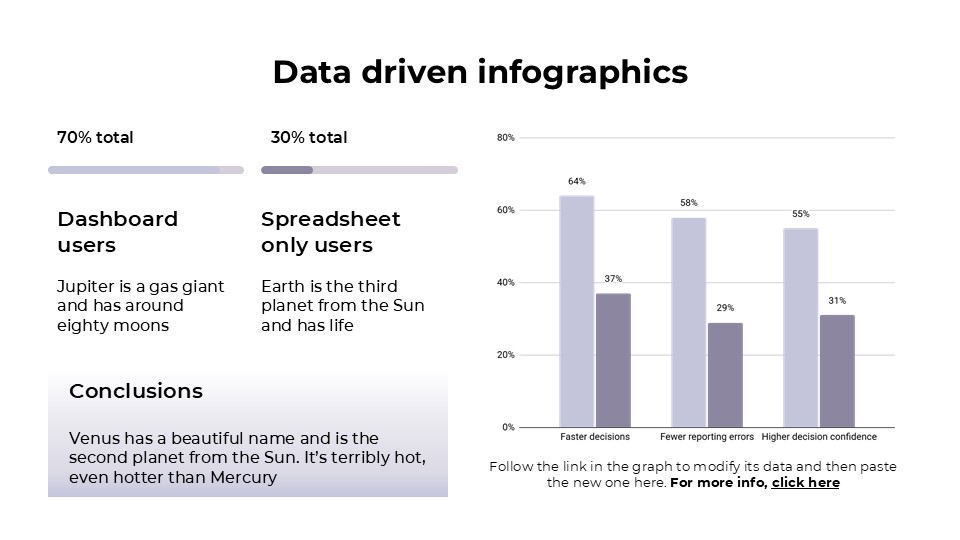
Data Driven Infographics
Free PowerPoint template and Google Slides theme
If you’re trying to share insights with a creative team, a classroom, or a lifestyle brand, you don’t want to look like a corporate robot. You want your data to feel as alive and approachable as the ideas behind it.
The Cute Data-Driven Infographics for Google Slides, PowerPoint, and Canva is the antidote to spreadsheet fatigue. It’s built for those who believe that “analytical” and “adorable” can—and should—live in the same deck.
The Aesthetic: Soft-Tech & Friendly Modernism
This isn’t just “cute” for the sake of being cute. The design philosophy is rooted in Accessible Data Storytelling, using a visual style that lowers the barrier to entry for complex information:
The “Candy-Coated” Palette: Think soft mints, playful corals, and sunny yellows. These colors are strategically chosen to make data feel less intimidating and more like a conversation.
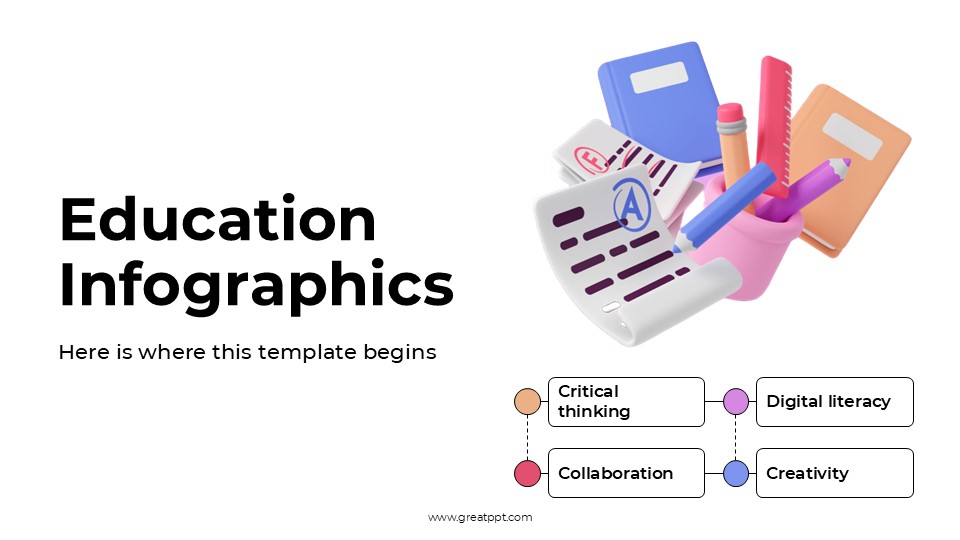
Hand-Drawn & Bubbled Elements: The template replaces sharp, aggressive corners with soft, rounded edges and charming, doodle-style icons. It gives your charts a “human touch” that purely automated tools often miss.
White Space Harmony: Despite the “cute” vibes, the layouts are incredibly disciplined. There’s plenty of room for your headers to breathe, ensuring that your key takeaways aren’t buried in the illustrations.
Purpose & Strategic Use Cases
This deck is a workhorse for anyone who needs to make “boring” stats look irresistible:
Social Media & Influencer Reports: Perfect for presenting your monthly engagement growth or audience demographics to potential brand partners.
Educational & Non-Profit Impact: Teachers and NGOs can use these slides to explain everything from student progress to community outreach metrics in a way that feels hopeful and engaging.
Startup Pitch Decks: If your brand is disruptively friendly—think “Chime” or “Lemonade”—this template aligns perfectly with a modern, consumer-facing brand identity.
Personal Finance & Goal Tracking: Great for creating a visual breakdown of your yearly savings or project milestones for a personal blog or workshop.
Features of this template
- 100% editable and easy to modify
- 11 Different slides to impress your audience
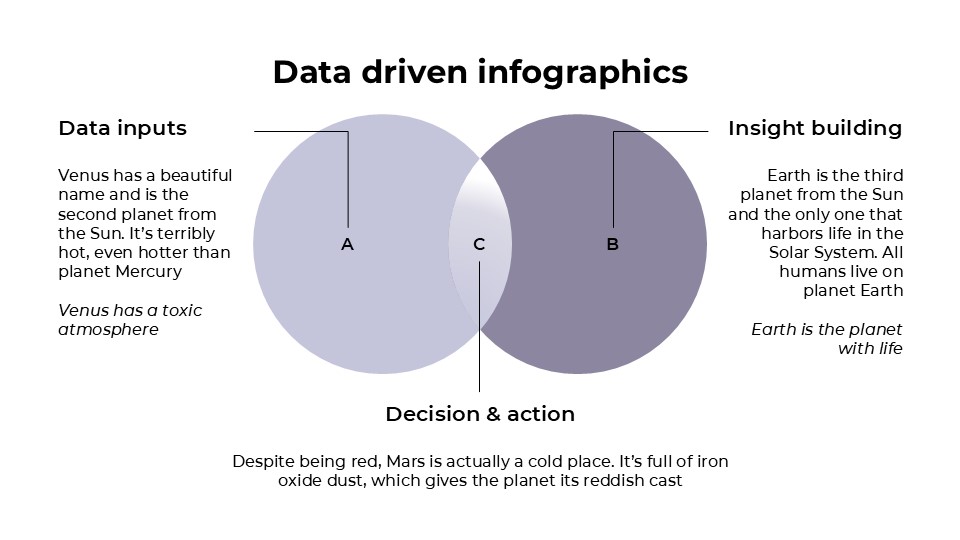
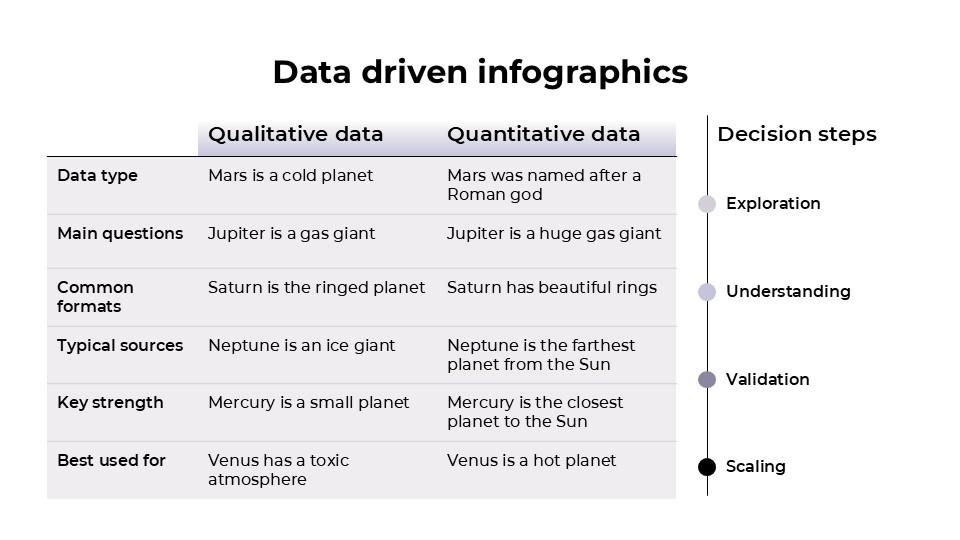
- Contains easy-to-edit graphics such as graphs, maps, tables, timelines and mockups
- Includes 500+ icons for customizing your slides
- Designed to be used in Google Slides, Microsoft PowerPoint & Canva
- Includes information about fonts, colors, and credits of the resources used
Video Preview of Data Driven Infographics
Share Now!
Presentation Tips


Related Products
Same Contributor
Featured Products