Chemical Reactions Infographics
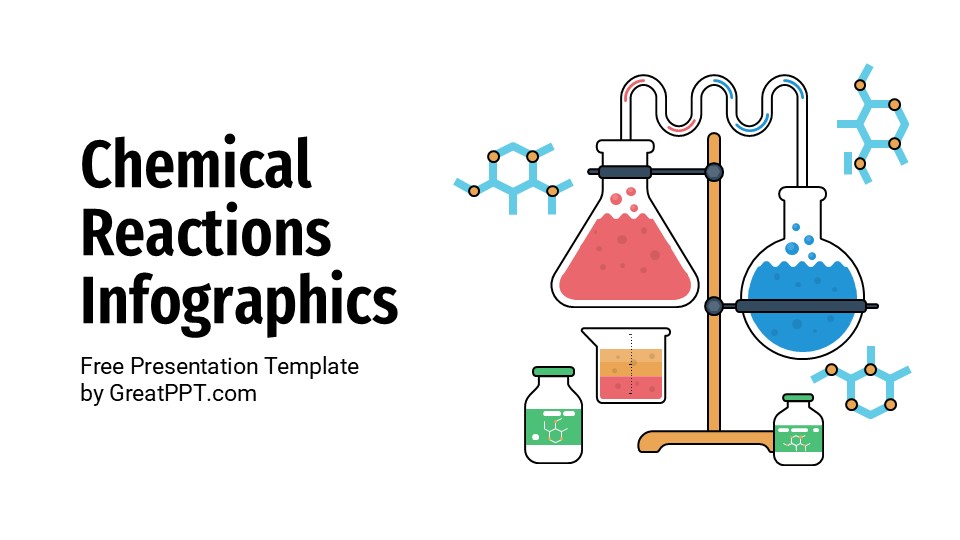
Chemical Reactions Infographics
Free PowerPoint template and Google Slides theme
Chemistry is fascinating, but if your presentation is just a wall of text-heavy stoichiometry problems, you’re going to lose your audience faster than an unstable isotope. Whether you’re a professor explaining exothermic bonds to a lecture hall or a biotech researcher pitching a new synthesis process in 2026, you need visuals that act as a catalyst for understanding—not a barrier.
The Chemical Reactions Infographics template for Google Slides and PowerPoint is a high-octane visual toolkit designed to turn complex molecular data into clear, “eureka” moments.
The Aesthetic: Laboratory Precision Meets Modern Design
This isn’t your average high school science fair poster. The design language here is “Clinical yet Vibrant”:
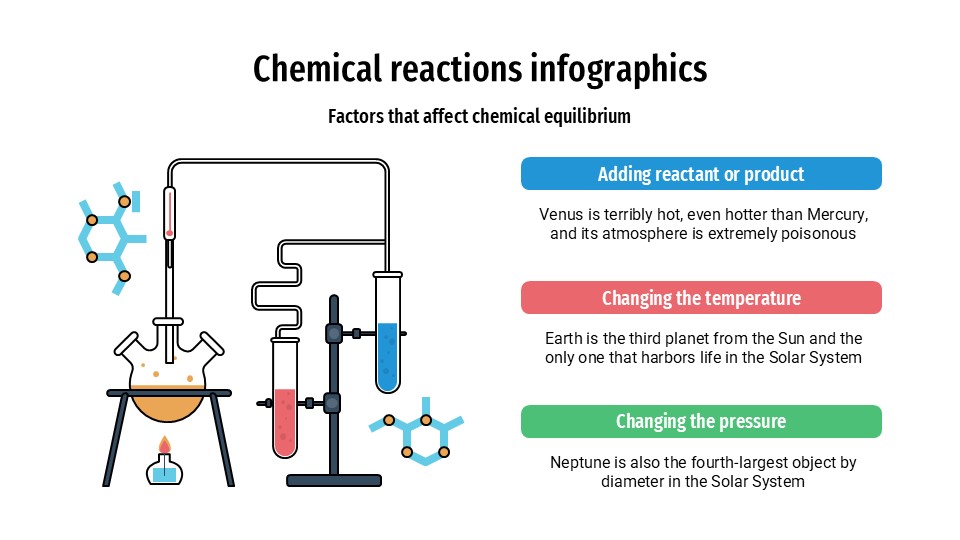
The “Neon-Lab” Palette: Utilizing a professional mix of electric blues, deep violets, and high-contrast oranges, the color story makes your data pop against dark or light backgrounds. It feels modern, energetic, and sophisticated.
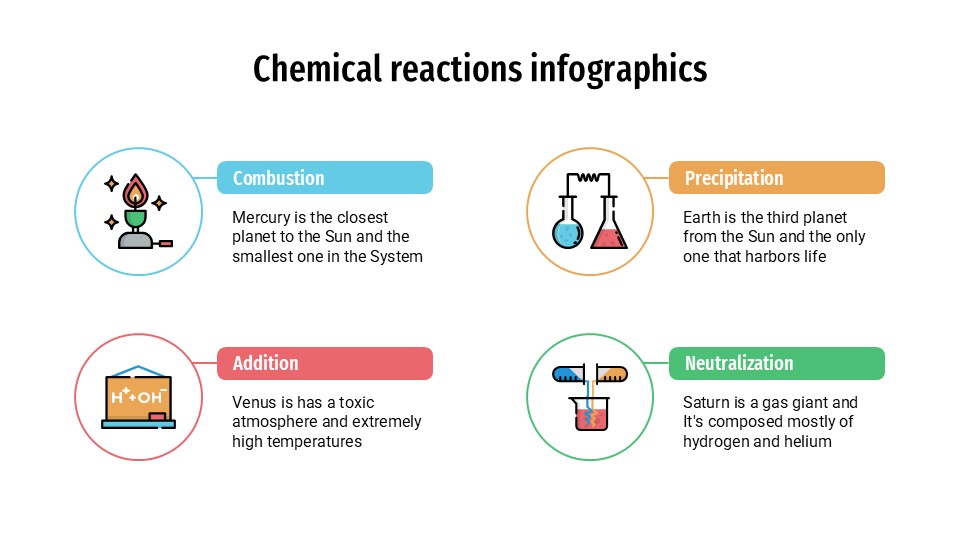
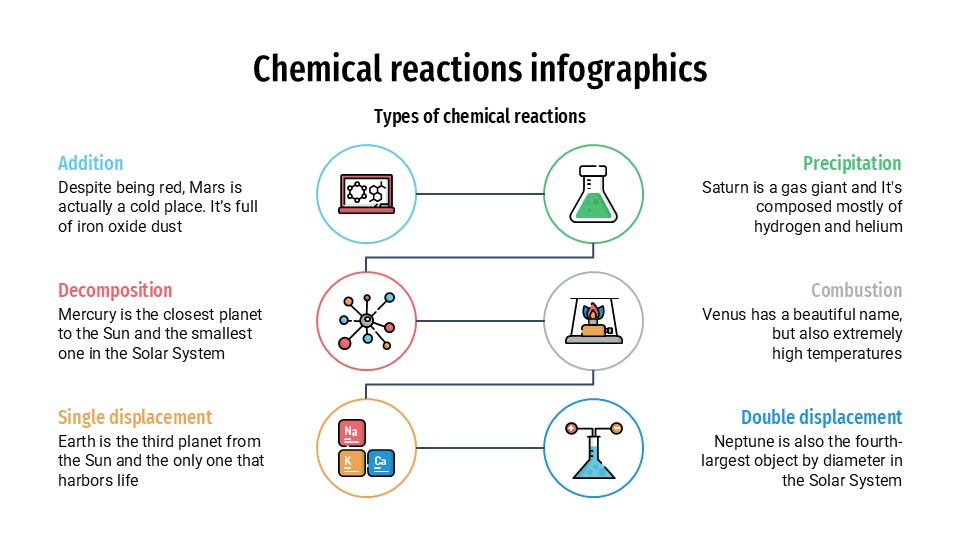
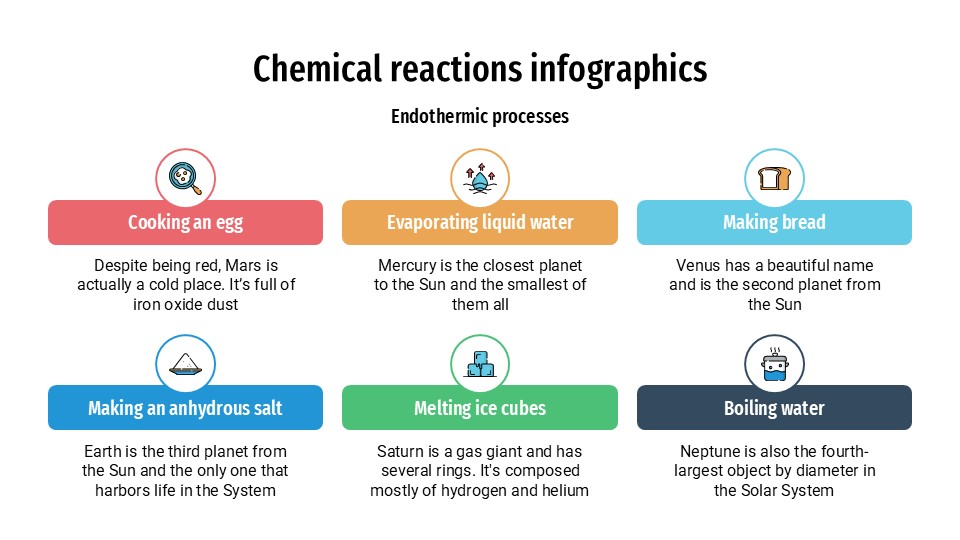
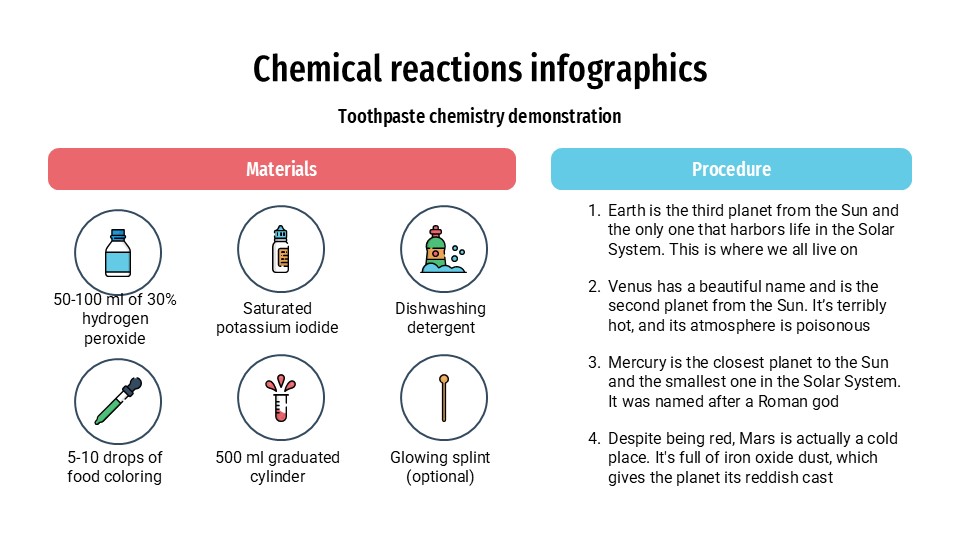
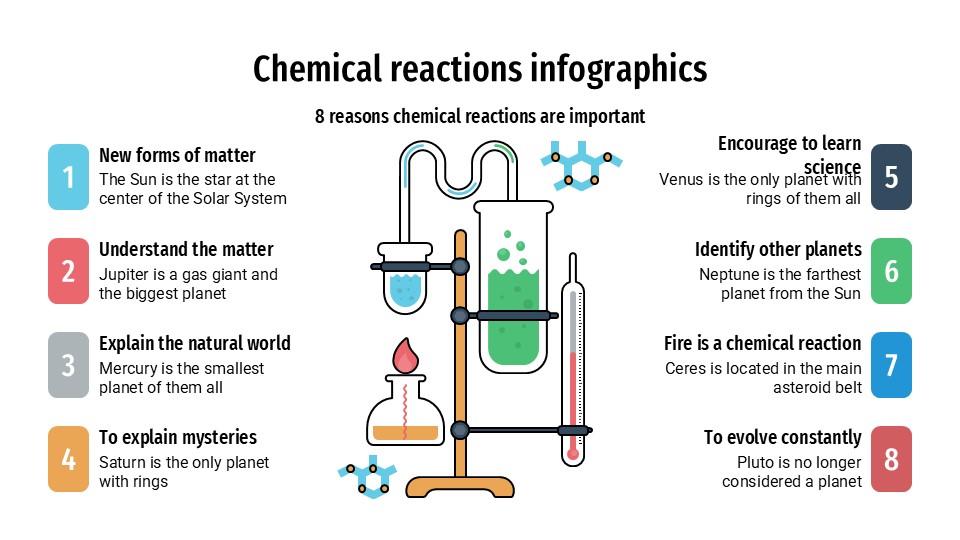
Vector-Perfect Science: The template is packed with high-quality icons of beakers, flasks, molecular structures, and bunsen burners. These aren’t just decorations; they are functional anchors for your data points.
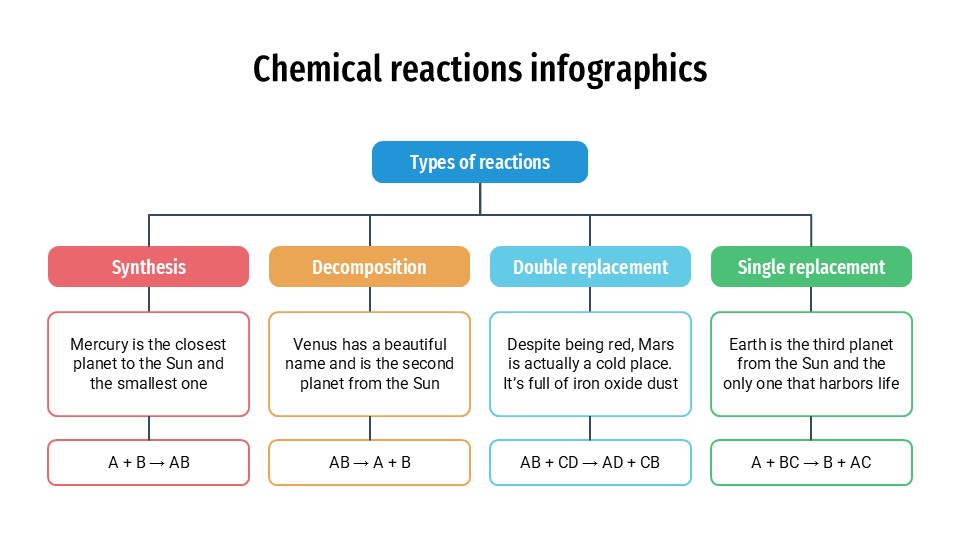
Structured Flow: Every slide is built with a logical, procedural flow in mind. From circular reaction cycles to linear process arrows, the layouts mirror the systematic nature of the scientific method itself.
Purpose & High-Impact Use Cases
This is a Multidisciplinary Science Framework built for a wide range of STEM professionals:
Academic Lectures & Research: Perfect for defending a thesis or breaking down the “Why” behind organic chemistry mechanisms. It keeps students engaged with visual storytelling rather than just rote memorization.
Biotech & Pharma Pitches: If you’re presenting a 2026 drug development roadmap or a new chemical manufacturing protocol, these infographics provide the professional “sheen” needed for investor decks.
Environmental Impact Reports: Use the flowcharts to visualize how chemical pollutants move through ecosystems or how new filtration systems react with contaminants.
STEM Workshops & Science Communication: Great for YouTube creators or science communicators who need to simplify high-level concepts for a general audience.
Features of this template
- 100% editable and easy to modify
- 31 Different slides to impress your audience
- Contains easy-to-edit graphics such as graphs, maps, tables, timelines and mockups
- Includes 500+ icons for customizing your slides
- Designed to be used in Google Slides, Microsoft PowerPoint & Canva
- Includes information about fonts, colors, and credits of the resources used
Video Preview of Chemical Reactions Infographics
Share Now!
Presentation Tips


Related Products
Same Contributor


Featured Products