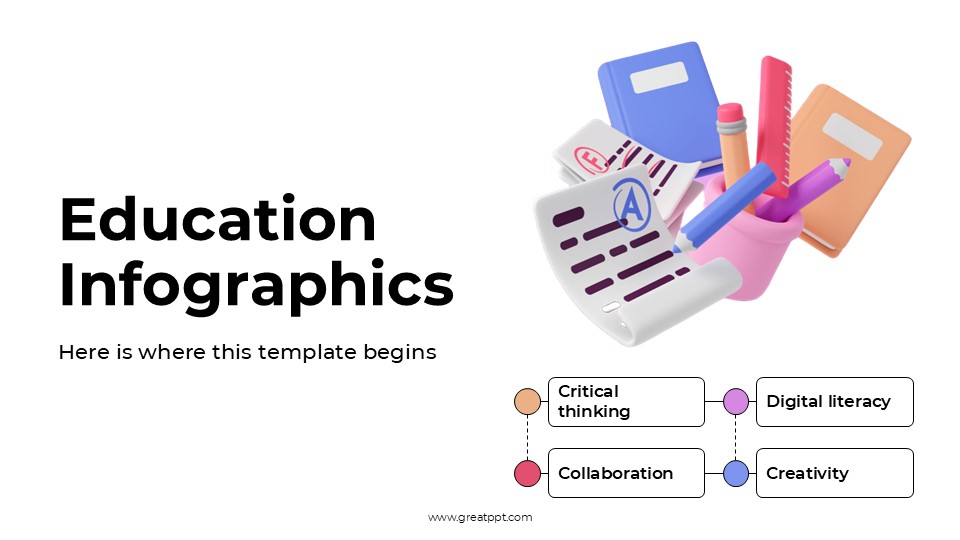
Business Diagram Infographics
Business Diagram Infographics
Free PowerPoint template and Google Slides theme
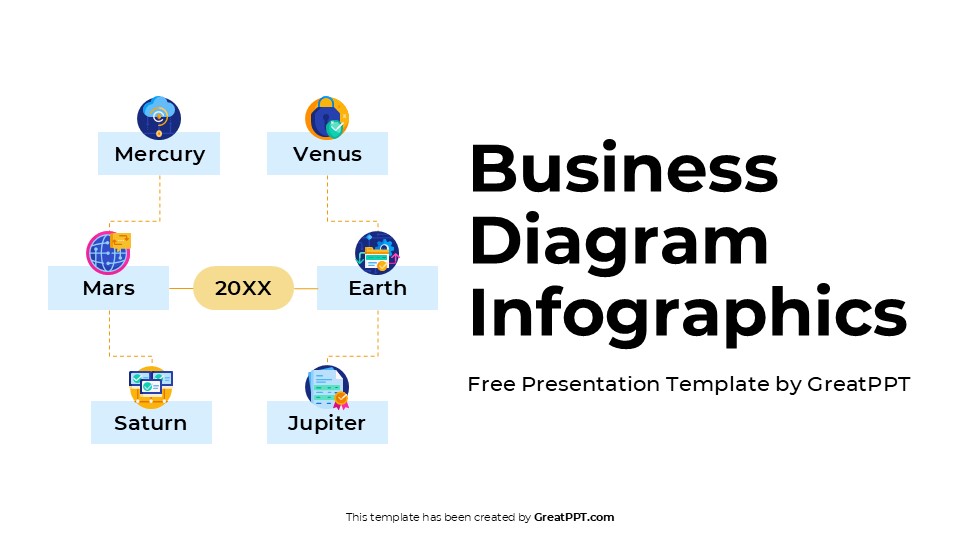
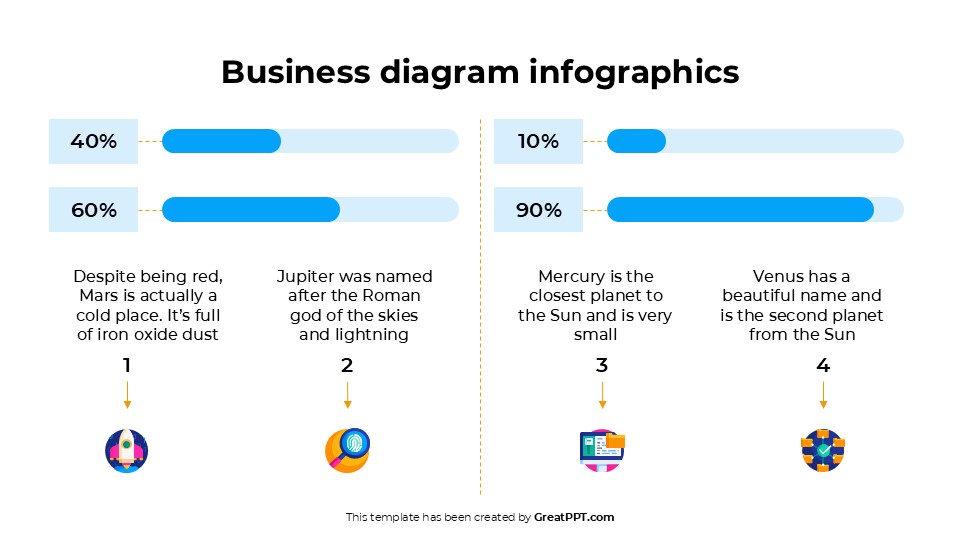
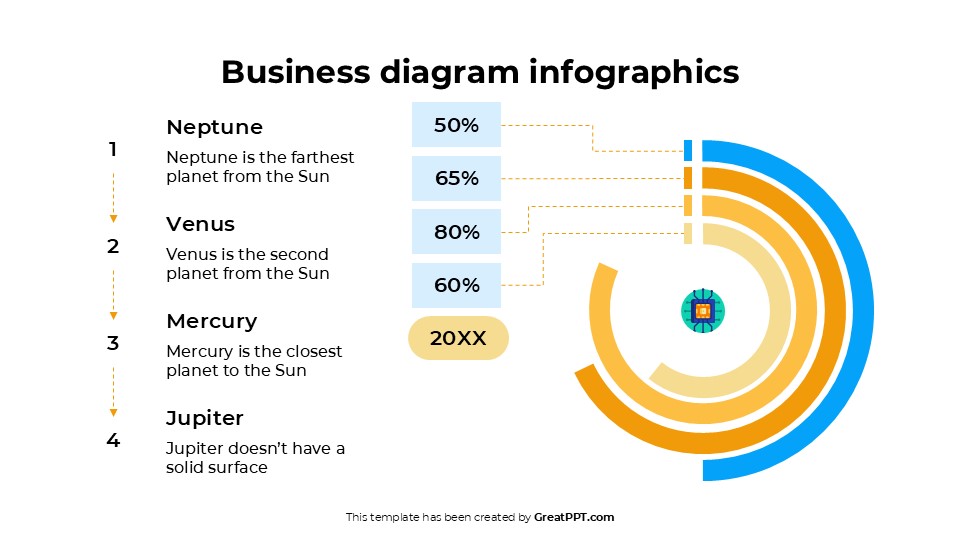
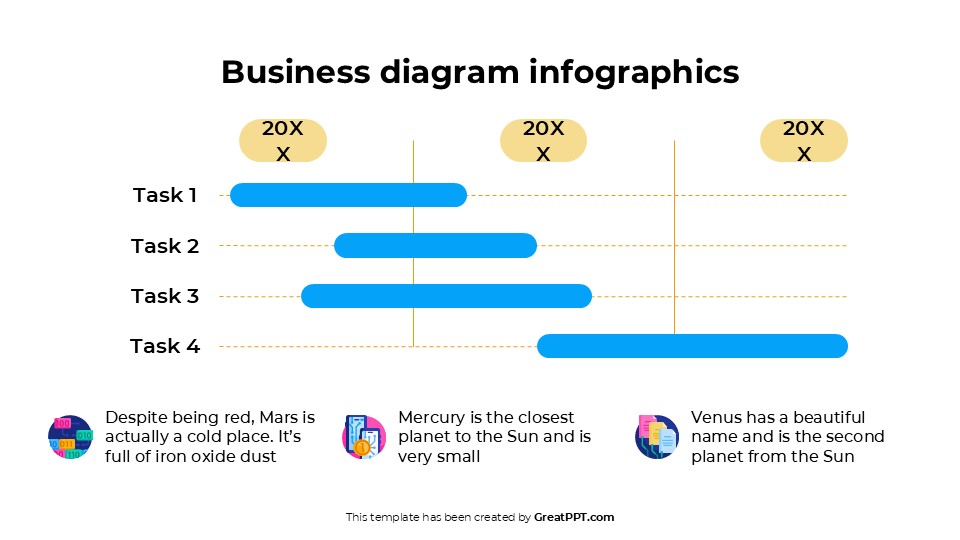
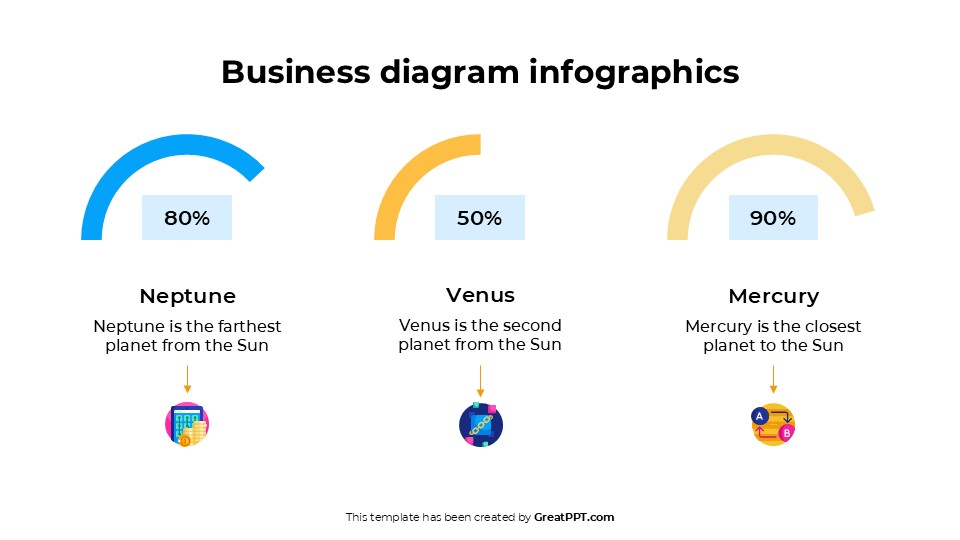
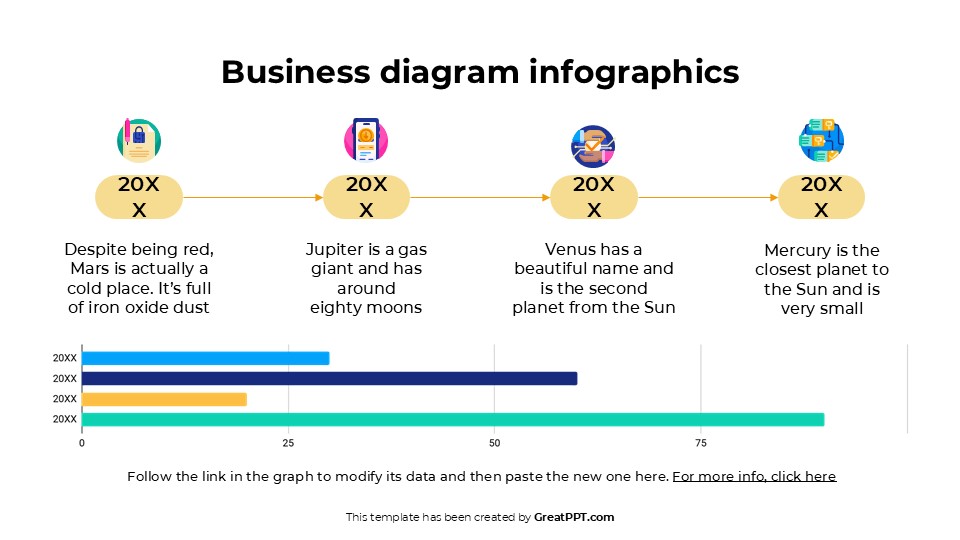
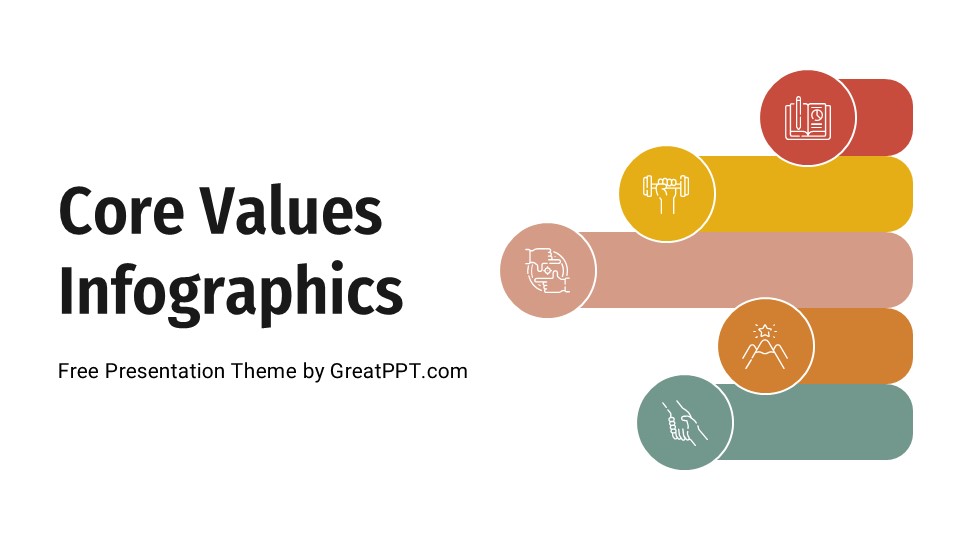
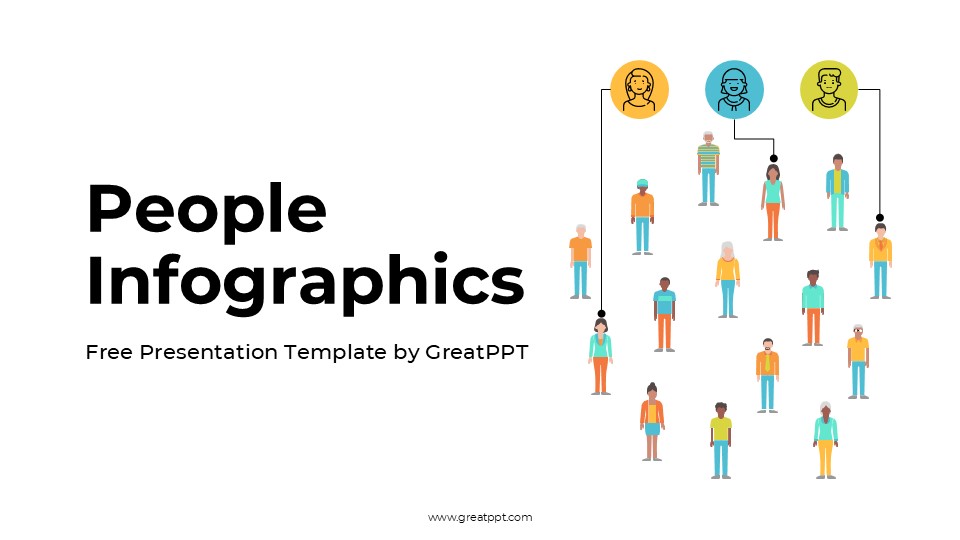
Elevate your next pitch or strategy meeting with the “Business Diagram Infographics (Professional)” template—a clean, visually compelling way to transform data-heavy content into sleek, professional slides. This template serves up a whole toolkit of diagram styles—snap-in hierarchies, arrows, hexagons, timelines, pie charts, bar graphs, maps—you name it, it’s here. Each slide lays out 4 to 7 items in a—balanced, structured way that keeps audiences focused and informed.
What makes this template especially user-friendly? It’s 100 % editable—every element, from colors and fonts to graphics and layout, can be adjusted to reflect your brand or project tone. Whether you’re working in Google Slides and PowerPoint, customization is seamless and intuitive.
Beyond style, it’s about clarity. These infographics are made to turn dense business metrics into sleek visuals—highlighting budgets, timelines, market segmentation, or growth projections without overwhelming your audience. Think of them as visual shortcuts that guide attention to what matters most.
In short: if you’re looking for a professional presentation template that marries high-impact visual storytelling with flexibility and polish, this business diagram infographics set delivers. It sharpens your message, simplifies complexity, and helps you present with confidence.
Features of this template
- 100% editable and easy to modify
- 12 Different slides to impress your audience
- Contains easy-to-edit graphics such as graphs, maps, tables, timelines and mockups
- Includes 500+ icons and Flaticon’s extension for customizing your slides
- Designed to be used in Google Slides and Microsoft PowerPoint
- Includes information about fonts, colors, and credits of the resources used
Video Preview of Business Diagram Infographics
Share Now!
Presentation Tips


Related Products

Same Contributor


Featured Products