Blue Water Cycle PowerPoint Template

Blue Water Cycle Presentation
Free PowerPoint template and Google Slides theme
Explaining how a puddle eventually becomes a storm cloud can either feel like a magic trick or a total snooze-fest. If you’re a science teacher trying to keep a room of eighth-graders from staring out the window, or an environmental consultant pitching a 2026 sustainability initiative, you can’t just rely on a dry textbook diagram. You need to make the invisible visible.
The Water Cycle template for Google Slides and PowerPoint takes the complex journey of a single H2O molecule and turns it into a crisp, fluid visual narrative. It’s not just “blue”—it’s a professional-grade toolkit for anyone telling the story of our planet’s lifeblood.
The Aesthetic: High-Definition Fluidity
This deck skips the grainy, dated clipart for a Modern Scientific look that feels both educational and high-end:
The “Oceanic” Palette: A sophisticated gradient of deep navy, vibrant cerulean, and soft mist-whites. It’s designed to look great on everything from a smartboard to a high-resolution tablet.
Flowing Visual Architecture: The layouts aren’t just boxes; they’re designed with rounded edges and arrow-driven paths that physically mimic the movement of water.
Crisp Vector Illustrations: From 3D-style clouds to detailed cross-sections of soil and aquifers, the graphics stay sharp no matter how much you zoom in.
Purpose & 2026 Sustainability Use Cases
In an era where “water security” is a top global priority, this template is built for more than just 5th-grade science:
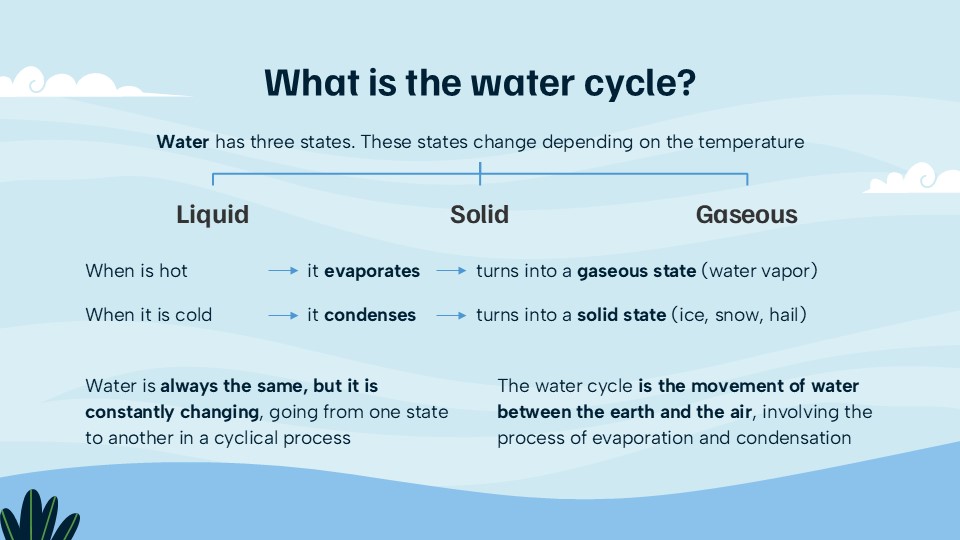
Environmental Science Education: Perfect for breaking down the big four: Evaporation, Condensation, Precipitation, and Collection.
Sustainability & ESG Reports: If your company is tracking its 2026 water footprint or “Net Positive” goals, use these slides to visualize your circular water management.
NGO & Climate Advocacy: Ideal for presenting on the impact of global warming on the hydrological cycle and localized drought patterns.
Infrastructure & Urban Planning: Use the modular maps to show how “Sponge Cities” or runoff systems interact with the natural cycle.
Features of this template
- 100% editable and easy to modify
- 23 Different slides to impress your audience
- Contains easy-to-edit graphics such as graphs, maps, tables, timelines and mockups
- Includes 500+ icons for customizing your slides
- Designed to be used in Google Slides, Microsoft PowerPoint & Canva
- Includes information about fonts, colors, and credits of the resources used
Video Preview of Blue Water Cycle Presentation
Share Now!
Presentation Tips


Related Products


Same Contributor

Featured Products