Ecosystem Infographics
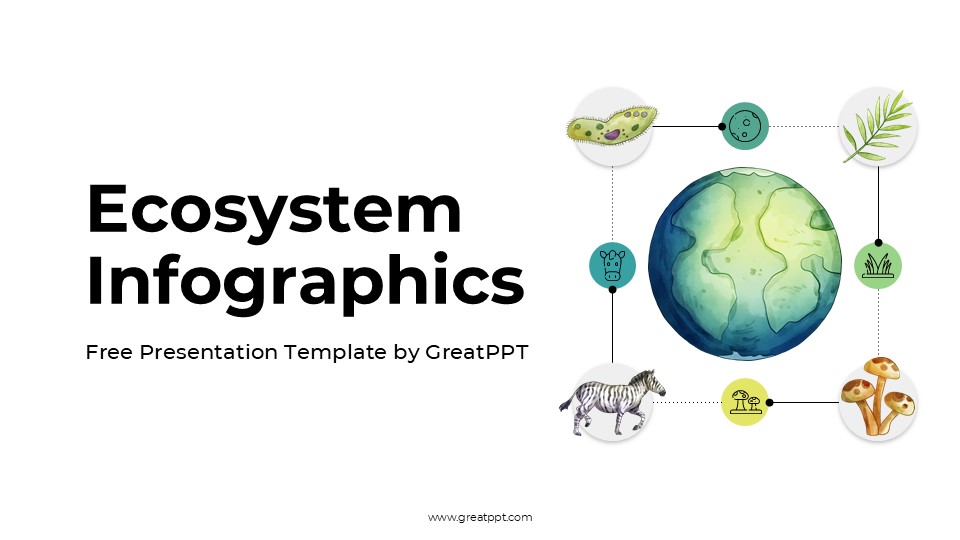
Ecosystem Infographics
Free PowerPoint template and Google Slides theme
Explaining how a complex system works—whether it’s a delicate rainforest canopy or a high-growth tech startup environment—is a massive challenge. If your slides are just a mess of arrows and text, your audience is going to tune out before you even get to the “Summary” slide. You need a way to show how individual parts move together to create a thriving whole.
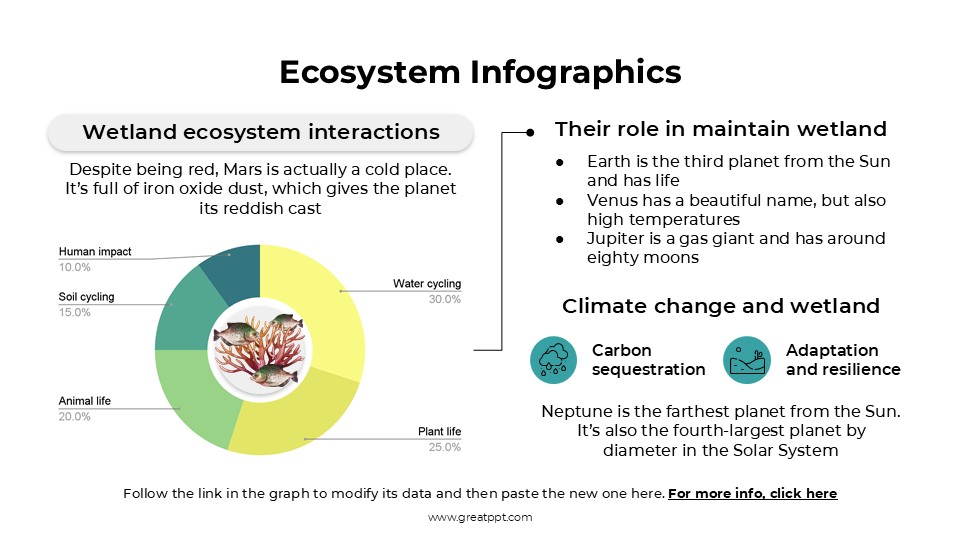
The Ecosystem Infographics for Google Slides and PowerPoint is a masterclass in visual harmony. It moves away from the “industrial” look of traditional charts and embraces a soft, organic design that feels as alive as the systems you’re describing.
The Aesthetic: Soft-Focus Professionalism & Organic Tones
This template leans into a “Bio-Digital” look that balances clinical precision with an approachable, modern feel:
The “Earth & Sky” Palette: Featuring a sophisticated blend of muted sage greens, soft terracottas, and airy creams, the color story is designed to evoke nature without feeling like a kid’s science project. It’s high-contrast enough for a boardroom but gentle enough for a long workshop.
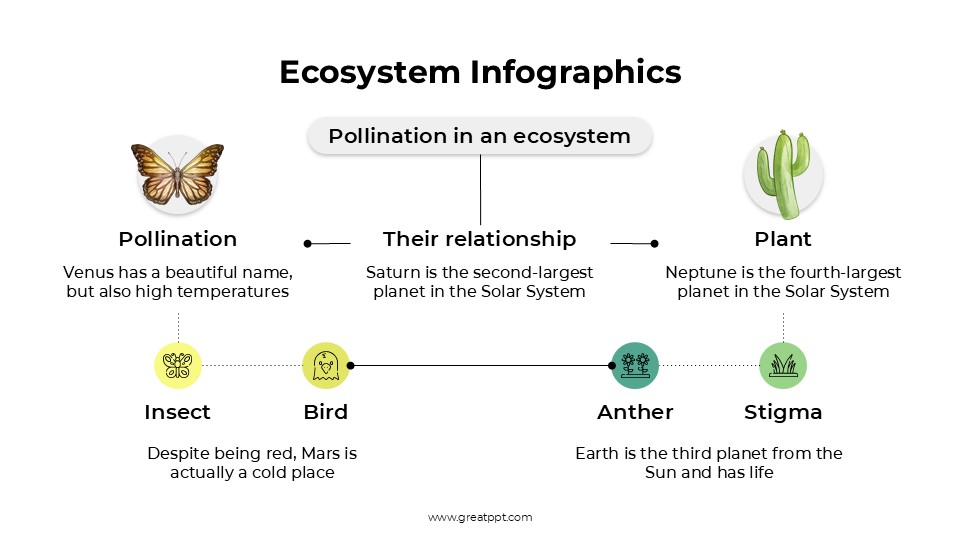
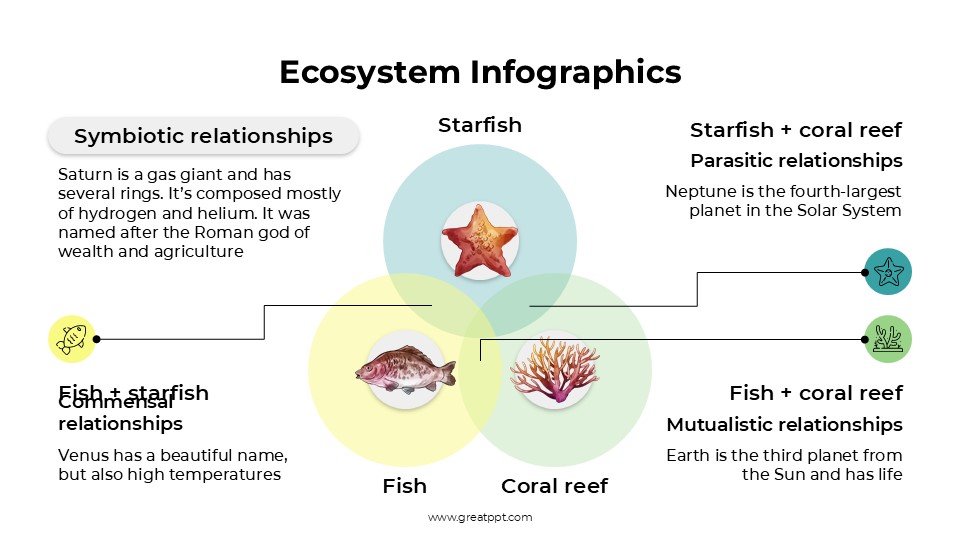
Flowing Geometry: Instead of rigid boxes, this template uses rounded nodes and curved connectors. This subtle design choice reinforces the idea of “flow” and “interdependence”—essential for any talk on ecosystems.
Minimalist Textures: With clean lines and plenty of white space, your data never feels crowded. It gives your “big ideas” room to breathe.
Purpose & Strategic Use Cases
This is a Systems-Thinking Toolkit built for anyone who needs to map out relationships and cycles:
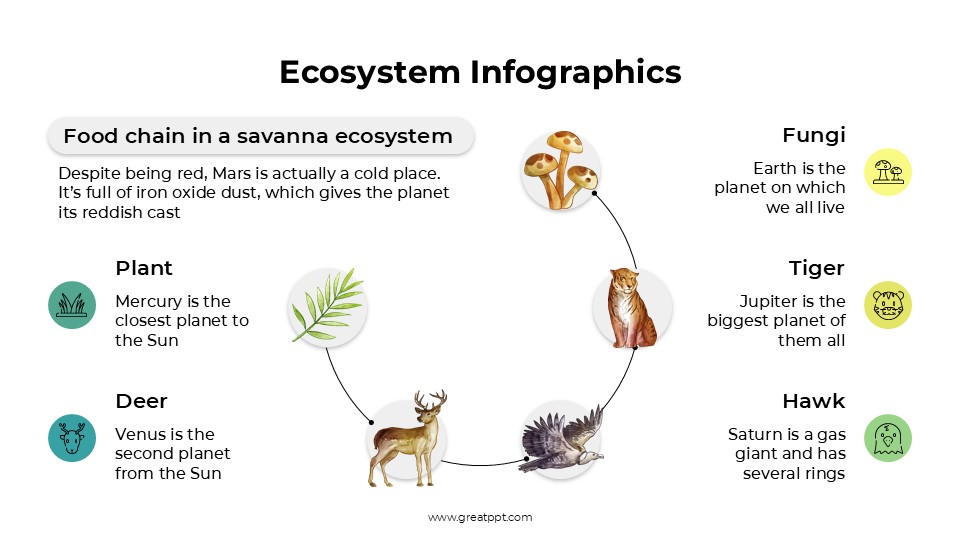
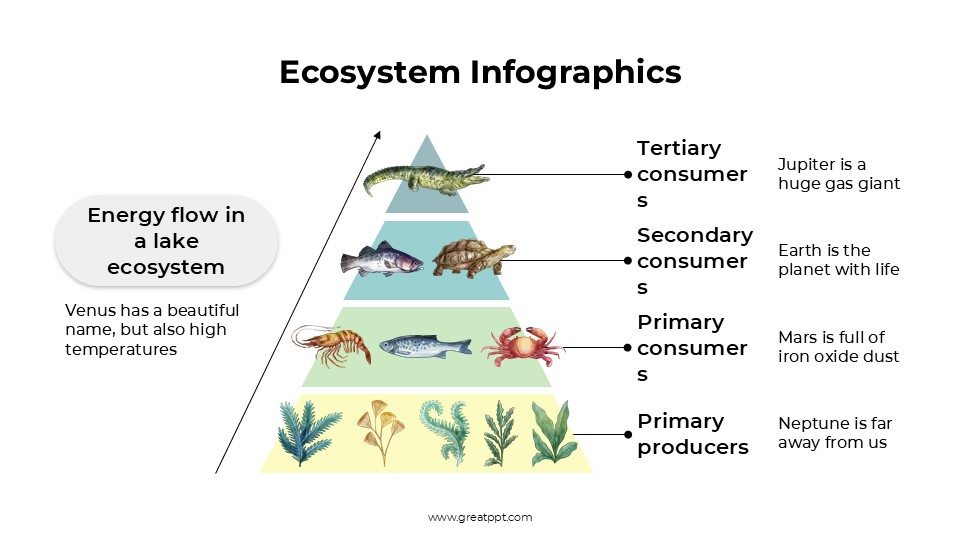
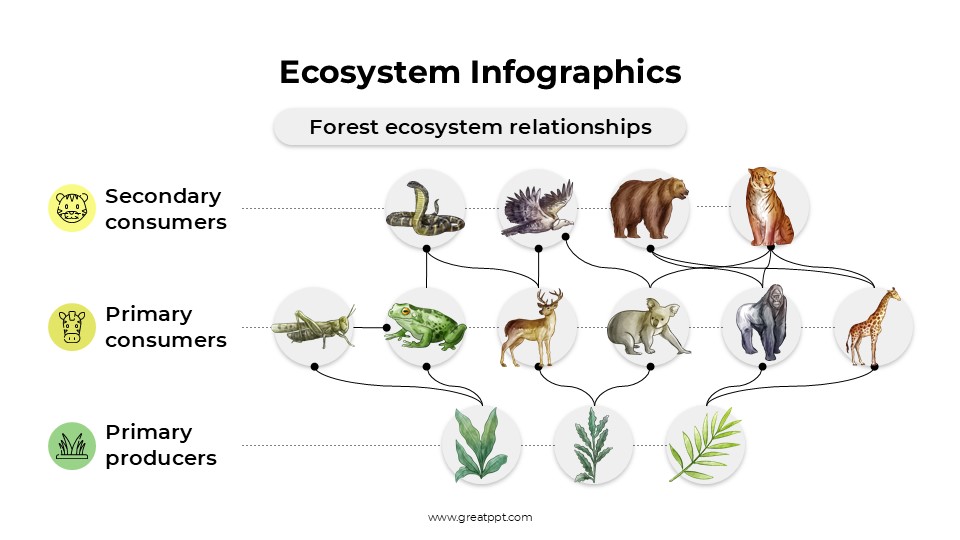
Environmental & Conservation Reports: Perfect for NGOs or research teams visualizing food webs, carbon cycles, or the impact of biodiversity loss in specific regions.
Business Ecosystem Mapping: Ideal for entrepreneurs and consultants who need to show the relationship between partners, customers, stakeholders, and digital platforms.
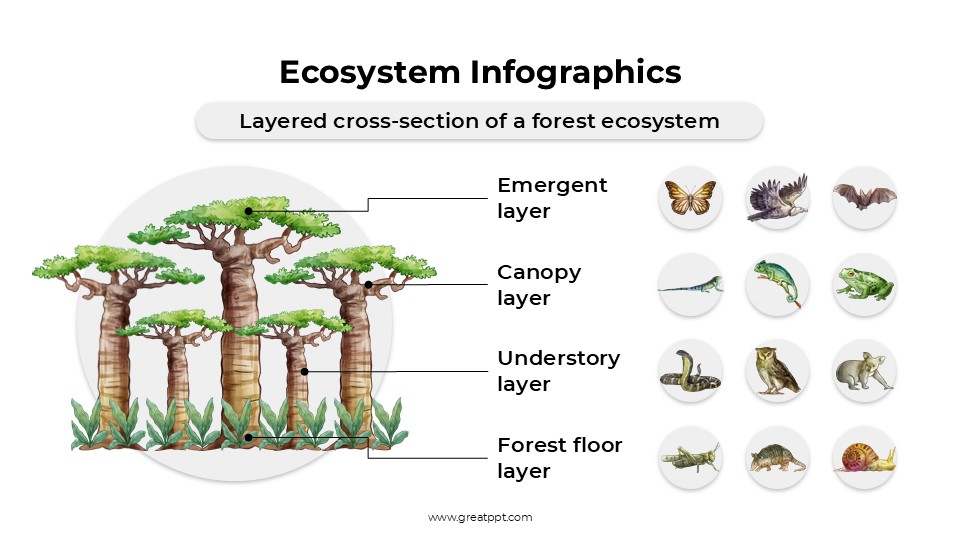
Educational Science Units: A go-to resource for teachers breaking down the “Seed-to-Forest” journey or the water cycle in a way that’s visually captivating for high school or university students.
Product Development Cycles: Use these slides to show how a new feature feeds back into the user experience and the broader company roadmap.
Features of this template
- 100% editable and easy to modify
- 19 Different slides to impress your audience
- Contains easy-to-edit graphics such as graphs, maps, tables, timelines and mockups
- Includes 500+ icons for customizing your slides
- Designed to be used in Google Slides, Microsoft PowerPoint & Canva
- Includes information about fonts, colors, and credits of the resources used
Video Preview of Ecosystem Infographics
Share Now!
Presentation Tips


Related Products
Same Contributor

Featured Products