


Showing 9 of 22 Blog Posts

Incorporating a table into your PowerPoint presentation is an excellent and efficient way to enhance your content. Tables can range from simple rows and columns to complex...

Infographics are diagrams designed to visually present information. Whether you're a teacher, student, marketer, or startup owner, GreatPPT offers a wide selection of free diagrams to enhance...

Mind mapping is an excellent technique for visually learning a series of concepts, ideas, or information. These mind maps resemble hierarchical diagrams with branching structures that should...

With PowerPoint, there are two primary methods to create an organizational chart, we will provide step-by-step instructions on both methods in this tutorial.

Timelines can be created in a wide range of colors, formats, and styles. While there are numerous creative approaches to designing them, they generally consist of a...
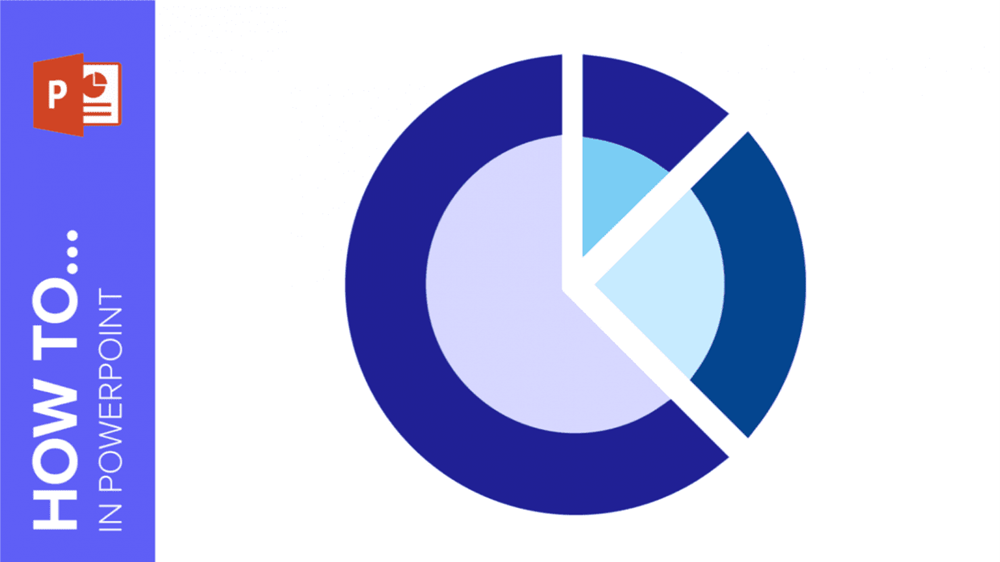
If you're seeking to enhance your presentations with diverse chart types, continue reading to discover how to create a radial chart in PowerPoint.
It’s estimated that 65 percent of humans are visual learners. That goes without saying that it is often easier to explain complicated concepts with visual aids than...

A flowchart is a graphic representation of a process in which each step appears as a symbol and these are connected with arrows. In this tutorial, you’re...
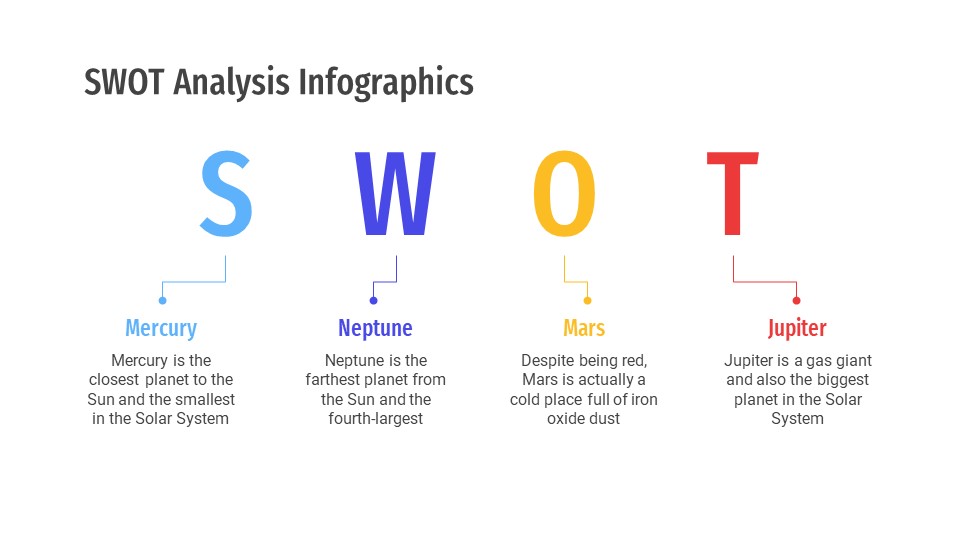
SWOT analysis (or SWOT matrix) is a strategic planning and strategic management technique used to help a person or organization identify Strengths, Weaknesses, Opportunities, and Threats related...